There is a potential double top pattern forming in the ES. Last Friday ES opened high and quickly lost upside strength and fell sharply.
The price action was bearish. But the bulls haven’t lost total control yet. The price hasn’t broken beneath a major support line at 1255.75, overlapping the low boundary of the uptrend channel.
ES will not give final confirmation that the short-term top has been posted until price closes below 1256.50. At that point 1225-1175 range will become the next downside target.
Daily momentum indicators remain in overbought territory. Now those indicators all point down, indicating a further decline is likely.
You can monitor the Naturus live chat room for 10 days for just $1. But don’t delay; the offer ends Tuesday. Here’s the link: http://naturus.com/dad.html
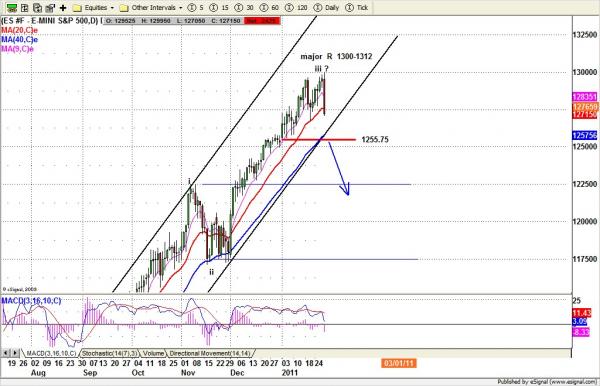
S&P 500 e-mini futures (ES). Daily chart