
A lot of investors are shaken by the volatility we’ve seen in the markets recently, particularly in metals. Year-to-date, gold is down 5 percent, silver is down 11 percent, and copper is down 2 percent. Trading commodity futures carries unique risks, and these volatile conditions create unique challenges to traders and investors. Last year, most commodities went straight up, but that trend isn’t likely to be repeated again. We are seeing now a decoupling of the commodity markets, with some of last year’s high-flyers now correcting back.
On Thursday, January 20, 2011, speculation that China would soon move to tighten monetary policy to curb growth triggered renewed declines in many commodities struggling to regain some lost ground. Gold edged down further Friday, to post its third straight weekly loss.
As a trader, it’s very important to determine just how much heat you can take before you even place a trade. Decide at what level you will exit a trade and how much you can afford to lose. Then, move on. You can’t get emotionally attached to a trade, because emotions often lead to more gambles. I think controlling your emotion is one of the keys to successful trading.
Gold
Gold saw a gain of 30 percent in 2010, but in 2011, it has fallen as investors unwound some of their safe-haven investments. From a technical perspective, the market was riding the nine-day moving average, and then broke that level. If the market can’t close above that average, it’s a sign of failure. Too many people were convinced gold wouldn’t correct, but all markets do.
In 2010, gold moved from $1,000 to $1,400 an ounce pretty quickly, without a significant correction. The choppy action we are seeing now may be a sign a healthy pullback might be underway. If you have long positions in gold that are profitable, I think it’s probably a good time to consider taking some or all of those profits. Be cautious. Don’t get greedy.
Gold’s decline of more than $20 an ounce on Thursday, January 20, 2011, indicates to me that the market is not done correcting from its record run in 2010. No one knows just how long a correction will last, or how far the market will fall. The price of gold is still only 6 percent below its record high of $1,420 hit in early December.
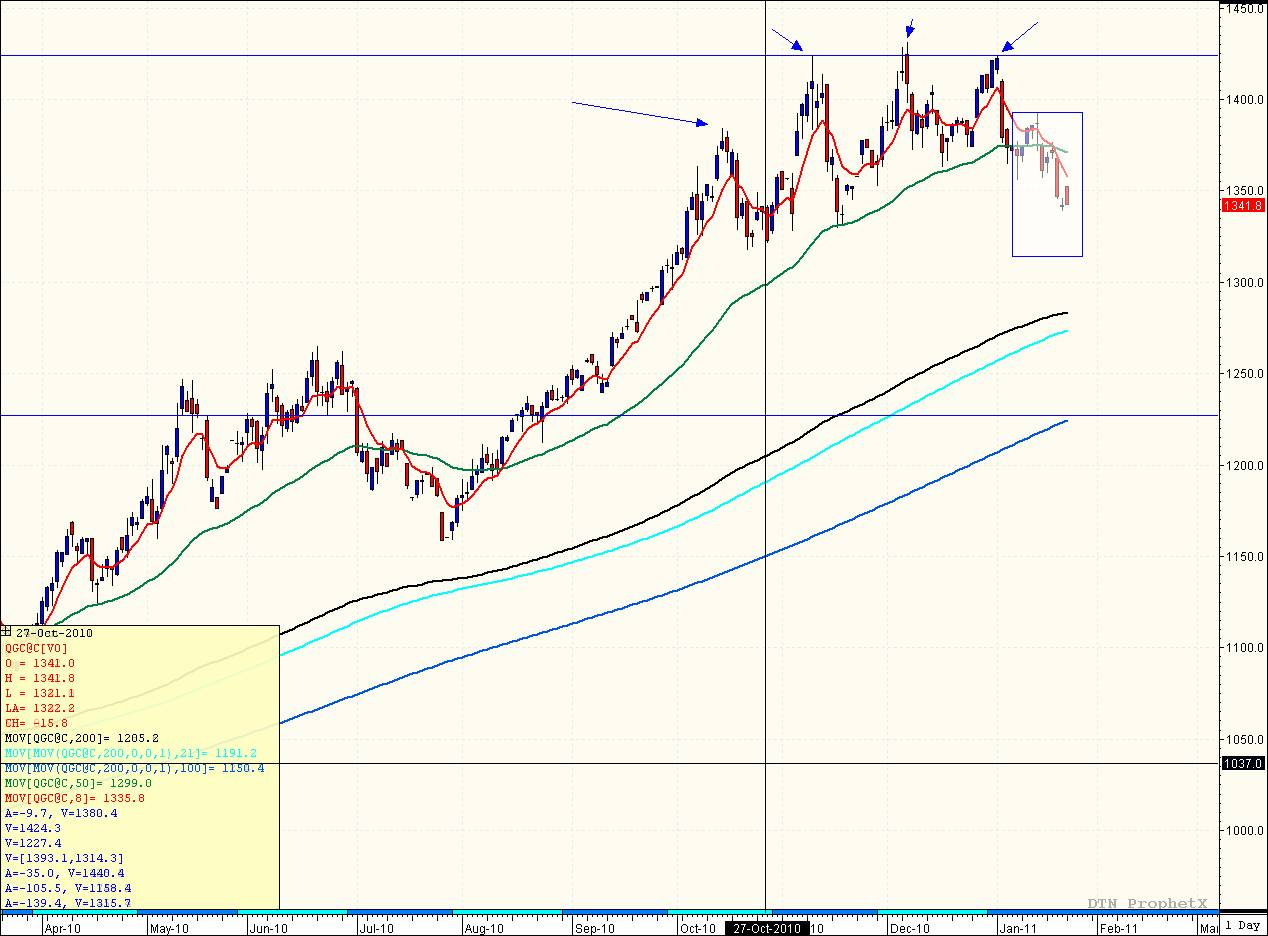
The high on December 12 was not challenged as the market rallied on January 3, and that to me was confirmation on the chart that the market was turning over. From October 14 to January 13, you can see how there is a curve to the overall top end. When the market started to fail at the averages in early January, it was another sign we could see it falling.
In the chart below, the 8-day average (red line) is crossing over the 50-day moving average (green line), showing us the market is not done correcting. It’s hard to pick a bottom, and no one can tell when it will happen. We could come back to the 200-day moving average (the black line on the chart below at 1285) before the market rebounds. The arrows in the chart represent the moon-looking curve.
Gold Futures, Daily Chart
Silver
Silver has been a highly speculative market, gaining more than 80 percent in 2010. The margin is over $10,000 per contract, which is indicative of the risk that comes with this market’s volatility. Silver tends to follow gold, so if you trade silver, you have to keep an eye on gold.
Given the recent volatility, there aren’t as many speculative positions in silver as there were a couple months ago; we’ve seen a big drop in open interest. If you want to trade a volatile market such as gold or silver, there are ways to manage the risk. However, sometimes the best strategy is to wait for direction and refrain from trading.
Crude Oil
Everyone remembers back in 2008 when crude oil moved above $140 a barrel and gasoline prices at the pump skyrocketed. Once it reached the psychological level of $100, it really took off. There have been signs we could see a repeat of that pattern, but you have to be patient. This market is also trading on emotion.
Short-term, this market could be volatile and play tricks on market bulls, but longer-term, inflationary trends seem likely in crude oil. In this market, don’t just jump in; pick your entry points carefully, and manage your trades.
March crude oil futures settled at $88.86 a barrel on Thursday, January 20, and ended Friday with a weekly loss of 3 percent. A positive sign was that the market held the 100-day moving average at $87.27 upon the release of the Energy Information Administration’s weekly oil inventories data, which showed a larger-than-expected build of 2.6 million barrels.
You might consider taking a chance on the buy side, as many analysts are still targeting $100 or more crude this year. Like gold and silver, this market could be volatile in the short-term. If you aren’t highly capitalized to withstand the volatility, I would recommend exiting any bullish futures trades if the market breaks the 100 day moving average at $87.02, or on a bigger move, the 200-day moving average at $84.92.
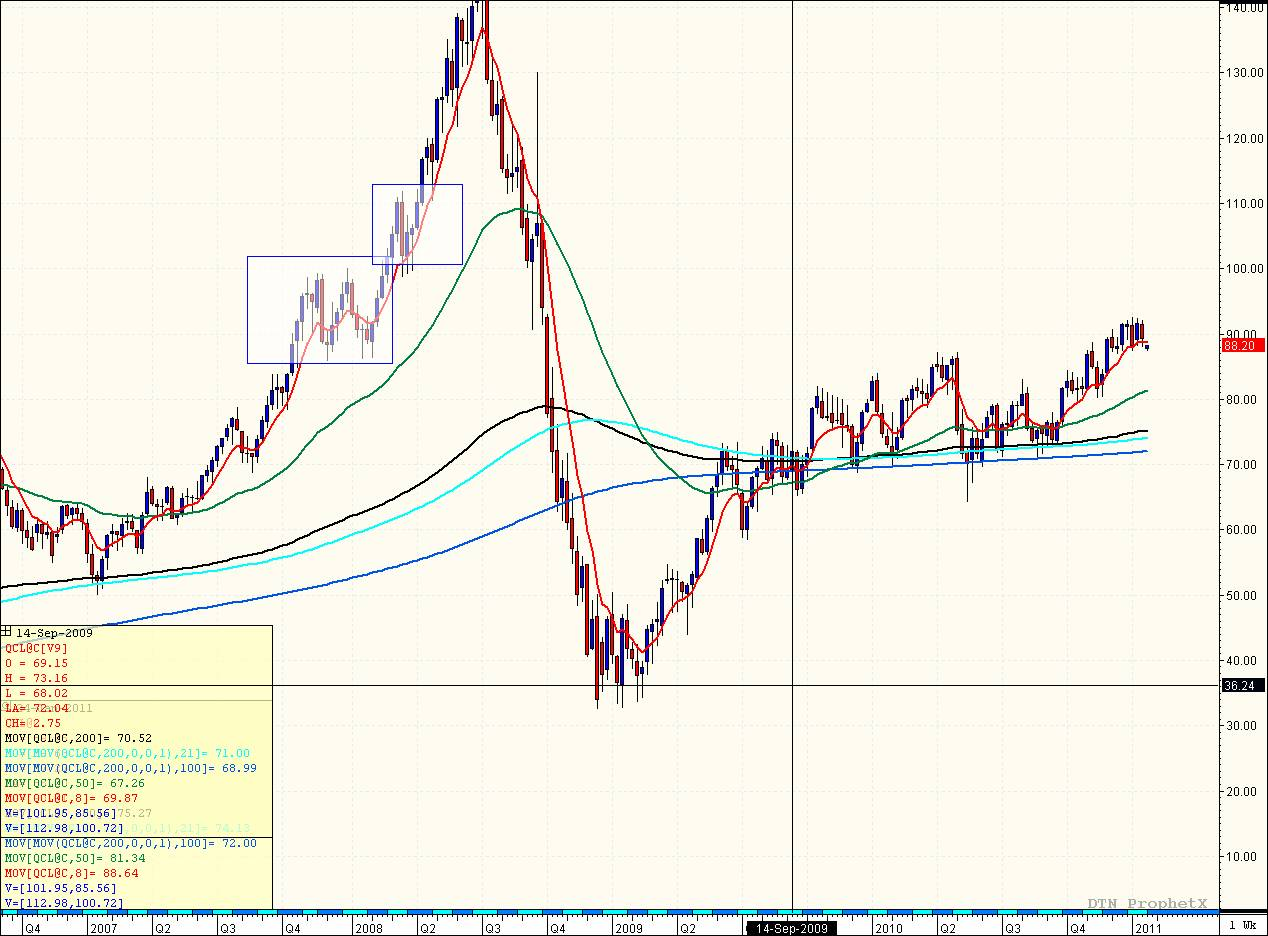
Looking at a weekly chart of crude oil, the moving averages are spreading out and turning up. Despite the mid-January selloff, that indicates to me the market is headed up, not down. I do think we’ll see $100 in the next three months. The market tried to test that level earlier this month, and I think it will likely test it again. However, I would urge caution if you want to trade the long side. There will be opportunities, so don’t rush to get in.
Crude oil is considered an indicator of the health of the economy, and is often correlated with moves in the stock market. However, once crude oil really takes off, it tends to trade on its own path. If we see a situation like we saw in 2008, crude oil could move up pretty quickly once it again approaches $100.
Right now, this market is acting similar to what we saw in 2008. Once the market reached up into the 90s, it began to experience huge corrections, then swing back up to new highs. I would expect similar nose-diving corrections ($4 to $9 possible) before breaking out into a new area. The name of the game in crude is v-o-l-a-t-i-l-i-t-y.
Crude Oil Futures Daily
In commodities overall, we seeing some giveback of what the markets gave us last year. Pick your markets and plan your trades carefully. Prepare for risk. Please feel free to contact me directly if you have any questions about the markets or to develop a trading strategy tailored to your unique goals and risk tolerance.
Futures trading involves substantial risk of loss and is not suitable for all investors. Past performance is not necessarily indicative of future trading results. Trading advice is based on information taken from trade and statistical services and other sources which Lind-Waldock believes are reliable. We do not guarantee that such information is accurate or complete and it should not be relied upon as such. Trading advice reflects our good faith judgment at a specific time and is subject to change without notice. There is no guarantee that the advice we give will result in profitable trades. All trading decisions will be made by the account holder.
©2011 MF Global Holdings Ltd. All Rights Reserved.141 W. Jackson Blvd, Suite 1400-A, Chicago IL 60604.
Tim Haberkorn is a Senior Market Strategist with Lind-Waldock. He can be reached at 800-993-6601 or via email at thaberkorn@lind-waldock.com.

