Stocks followed through on Tuesday’s bullish reversal action with a strong morning session that saw most averages up 1.5% by 11:30 am. After what appeared to be a bullish, sideways drift through lunch, stocks sold off sharply in the final hour of trading, with most averages giving back all of the days gains and more. The small-cap Russell 2000 and S&P Midcap 400 just managed to hold on to a positive close with gains of 0.24% and 0.09% respectively. The Dow Jones Industrial Average, Nasdaq Composite, and S&P 500 all shed about 0.5%. While most would argue that giving back the entire day’s advance in to the close was quite negative, we tend to see the glass half full here. If the major averages can rally above yesterday’s high, then we could see a decent rally develop, as the longs who sold into yesterday’s ugly close have to buy back in at higher prices or risk missing a rally.
Total volume fell off the prior day’s pace by 5% on the NYSE and 15% on the Nasdaq. Market internals confirmed the strong morning session with up volume beating down volume by a very bullish 8 to 1 margin at the highs of the day. As we already know, the strength did not last, as the up/down volume ratio sank into negative territory by the close.
We see two potential scenarios that could play out in United States Natural Gas Fund (UNG) over the next few days for those who missed our original entry point and still wish to get long.
The pullback buy:

UNG is currently in pullback mode. Whenever a stock or ETF breaks out on decent volume, any pullback to the breakout pivot (top of the range) is usually low-risk buy point that takes advantage of short-term weakness.
The breakout buy:

A temporary selloff below the 20-period exponential moving average can often lead to a sharp reversal to the upside when a new trend is in place (like UNG).
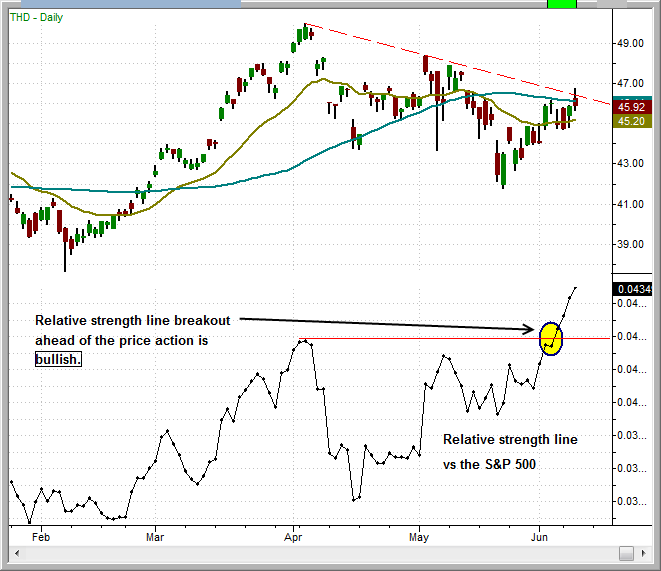
Per intraday alert, our buy entry in iShares Thailand Index (THD) triggered yesterday at 46.44 (at 9:35 am). In yesterday’s report, we mentioned that THD was showing relative strength to the U.S. stock market averages, as it was trading above the 200-day and 20-day MA’s and poised to reclaim the 50-day MA. Another way we spot relative strength is by using an indicator that plots THD’s performance vs the S&P 500 on a chart. This method is the quickest way to spot relative strength. Note how the relative strength line in THD has already broken out to new highs well ahead of the price action, which is a very positive sign.

SPDR S&P Retail (XRT) remains on our watchlist. The recent two-day undercut below the prior swing lows may have washed out all the longs who attempted to catch the last move out that failed to follow through. We could see a decent rally emerge with a close above the high of yesterday’s ugly candle.

Stepping down to the hourly chart in XRT we see that the current pullback is finding support just above 38.00:

We have the 50-day moving average in mind as a short-term target for this setup. If broad market conditions improve, then we could easily see XRT run through the 50-day MA and test the 43.00 – 44.00 level. XRT is home to some of the better chart patterns in the market with stocks such as PLCE, ANN, WFMI, LTD, DLTR, and ROST.
| Open ETF positions:
Long – UNG, THD |
 |
Deron Wagner is the Founder and Head Portfolio Manager of Morpheus Trading Group, a capital management and trader education firm launched in 2001. Wagner is the author of the best-selling book, Trading ETFs: Gaining An Edge With Technical Analysis (Bloomberg Press, August 2008), and also appears in the popular DVD video, Sector Trading Strategies (Marketplace Books, June 2002). He is also co-author of both The Long-Term Day Trader (Career Press, April 2000) and The After-Hours Trader (McGraw Hill, August 2000). Past television appearances include CNBC, ABC, and Yahoo! FinanceVision. Wagner is a frequent guest speaker at various trading and financial conferences around the world, and can be reached by sending e-mail to deron@morpheustrading.com.
DISCLAIMER: There is a risk for substantial losses trading securities and commodities. This material is for information purposes only and should not be construed as an offer or solicitation of an offer to buy or sell any securities. Morpheus Trading, LLC (hereinafter “The Company”) is not a licensed broker, broker-dealer, market maker, investment banker, investment advisor, analyst or underwriter. This discussion contains forward-looking statements that involve risks and uncertainties. A stock’s actual results could differ materially from descriptions given. The companies discussed in this report have not approved any statements made by The Company. Please consult a broker or financial planner before purchasing or selling any securities discussed in The Wagner Daily (hereinafter “The Newsletter”). The Company has not been compensated by any of the companies listed herein, or by their affiliates, agents, officers or employees for the preparation and distribution of any materials in The Newsletter. The Company and/or its affiliates, officers, directors and employees may or may not buy, sell or have positions in the securities discussed in The Newsletter and may profit in the event the shares of the companies discussed in The Newsletter rise or fall in value. Past performance never guarantees future results.
Charts created by TradeStation (tradestation.com).
© 2002-2010 Morpheus Trading, LLC
Reproduction without permission is strictly prohibited.


