

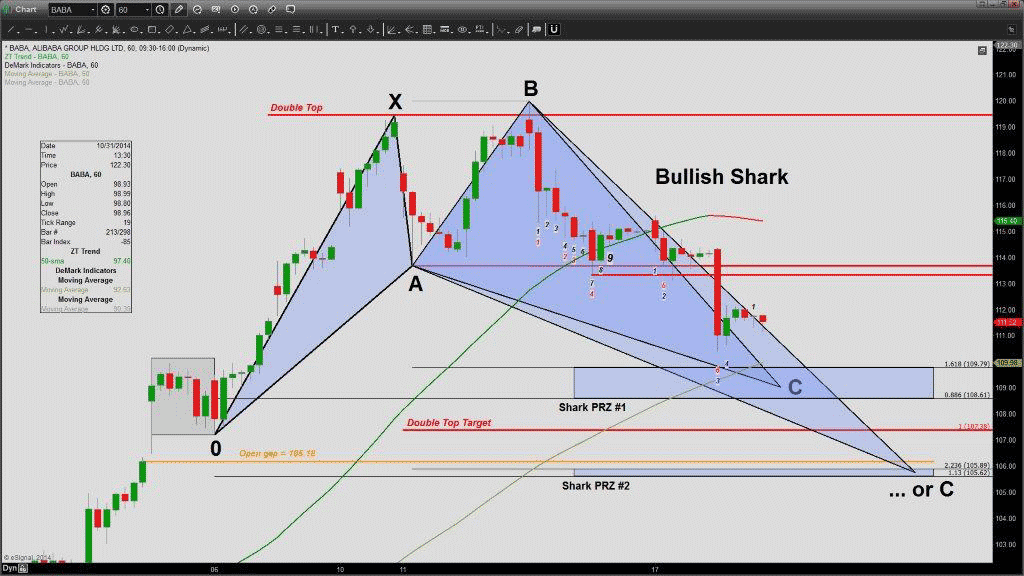
All stocks are subject to the law of Supply and Demand, and BABA is certainly no exception. On the heels of a widely successful initial public offering, this stock’s recent 13.4% decline was ushered in by the double-top pattern depicted on the 60-minute chart below. Aside from the double top whose downside target I measured to be in the vicinity of 107, I also identified a bullish Shark harmonic pattern (0-X-A-B-C) having two Potential Reversal Zones (PRZ): 109.79/108.61 and 105.89/105.62.
As a side note, I’m often asked why a harmonic chart pattern is dubbed BULLISH when the stock in question is clearly on the decline. The answer is because once price finally reaches the pattern’s objective, i.e., the Potential Reversal Zone, a potential BULLISH reversal is to be expected.
In the case of BABA, price pierced PRZ #1 on the way down to the double-top’s target, setting the stage for a tradable bounce up to the 115 area. However, once it subsequently fell back below point A (113.69) and progressively weakened, it became clear that the bullish Shark’s PRZ #2 was the next objective.
But That’s Not All She Wrote
Having reached and exceeded the Shark‘s PRZ #2 on December 1st, BABA staged yet another bounce that once again proved unsustainable. As of Monday, the stock was back down flirting with PRZ #2. The question is: what next?
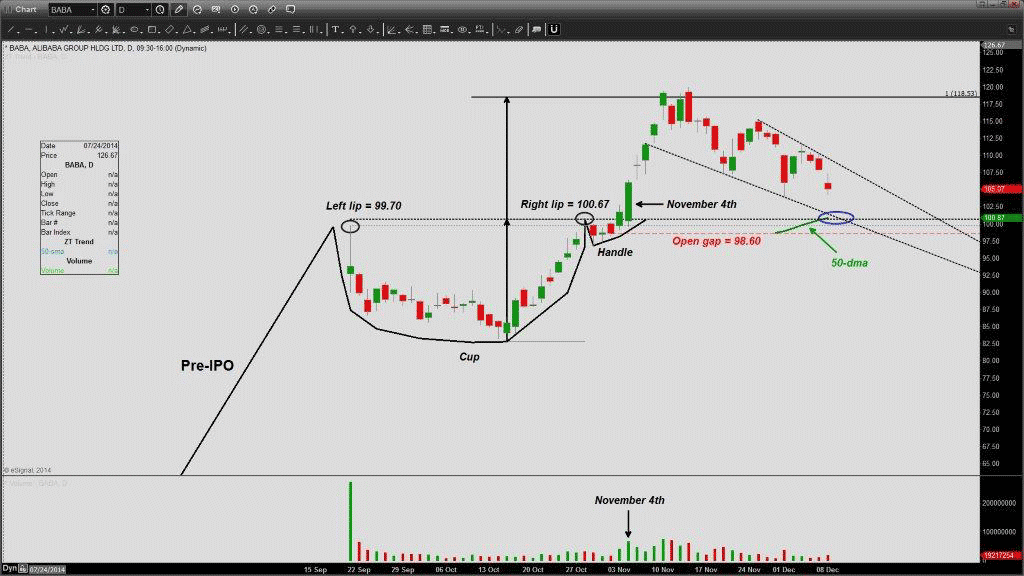
Depicted on the daily chart below is BABA’s entire journey, including its pre-IPO rise leading up to the Cup-and-Handle pattern. Price is shown to have reached and slightly exceeded the pattern’s measured move before giving way to the ongoing decline that’s clearly been unfolding within the confines of two converging lines. Another pattern is at hand: a Falling Wedge.
Note that when price broke out of the Cup-and-Handle pattern on November 4th, it left behind the tallest green candle to date, accompanied by the third largest volume bar in BABA’s brief trading history. Hence, I’m expecting the Cup-and-Handle’s rim (i.e., the thin price zone established by the left and right lips, i.e., 99.70/100.67) to be vehemently defended.
As price steadily approaches the aforementioned area, it’s also closing in on the Falling Wedge’s lower trend line and, guess what else – the 50-day moving average (50-DMA), which made its first appearance on November 28th. In fact, the Cup-and-Handle’s rim, the Falling Wedge’s lower trend line, and the 50-DMA have clearly joined forces to establish a support stronghold in the 100 area.
This has been my view for the last couple of weeks. On the heels of a breathtaking run, the stock needed to exhale, and so it succumbed to the gravitational pull of mean reversion. I for one can’t wait to put some money to work as early as Tuesday!
#####
For more information about this and other trades, please click here.

