These are just a few charts that I found interesting. I probably wouldn’t do anything long term in any of them. I like the day trades. But it is kinda nice to have a long term image in your head when you pull the trigger. Resistance and support, volume trends, and moving averages can always help in determining a safe place of entry.
 All of that volume on the weekly chart, contributing largely to a series of small candles could signal indecision. When coupled with the high stochastic and the descending 50 week and the nearing 200 week resistance, I’m going to say there’s a chance for a pullback. Especially as it reaches 37 or so. |
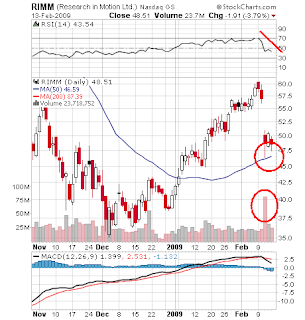
 RIMM is flirting with its 50 day moving average after posting earnings. With so much volume on the first gap down, I’m going to say that there is a good chance it won’t be able to break that day’s highs. A look at the intraday would help determine the likelihood of that statement. A break below the 50 is not a good sign. Well, for the longs that is. |
 Looks like COH is coming up to its lows. I’d be careful, as retail sales are likely to continue sucking. But, with the declining volume over the last few days, I wouldn’t be surprised to see this turn upwards. Then again, just because it hasn’t gone lower, does not mean to hold onto a stock while it continues lower. Bail this shit if it break down on heavy volume. I never understood $400 purses for women who make that much, after taxes, in a week, anyway. |


