

There are a lot of reasons to be cautious about the US equity markets right now. The S&P500 large cap index (SPX) has more than tripled in the last 68 month; it has been five years since we last saw a 20% retracement.
There are disturbing anomalies. Small cap equities – which usually lead the market at inflection points – are not making new highs, while the large caps chalk up new highs literally every other day, eight in the last 15 trading days, in fact.
And the market just feels jittery. The “wall of worry” bull markets have to climb is getting steeper, and the signs of a coming storm are intensifying.
- Insiders selling instead of buying.
- The Fed getting out of the quantitative easing business (supposedly).
- The mounting discontent of the American consumer, even as the Black Friday madness and the Christmas Follies accelerate.
It is starting to feel creepy, and then there is the Megaphone …
The Megaphone
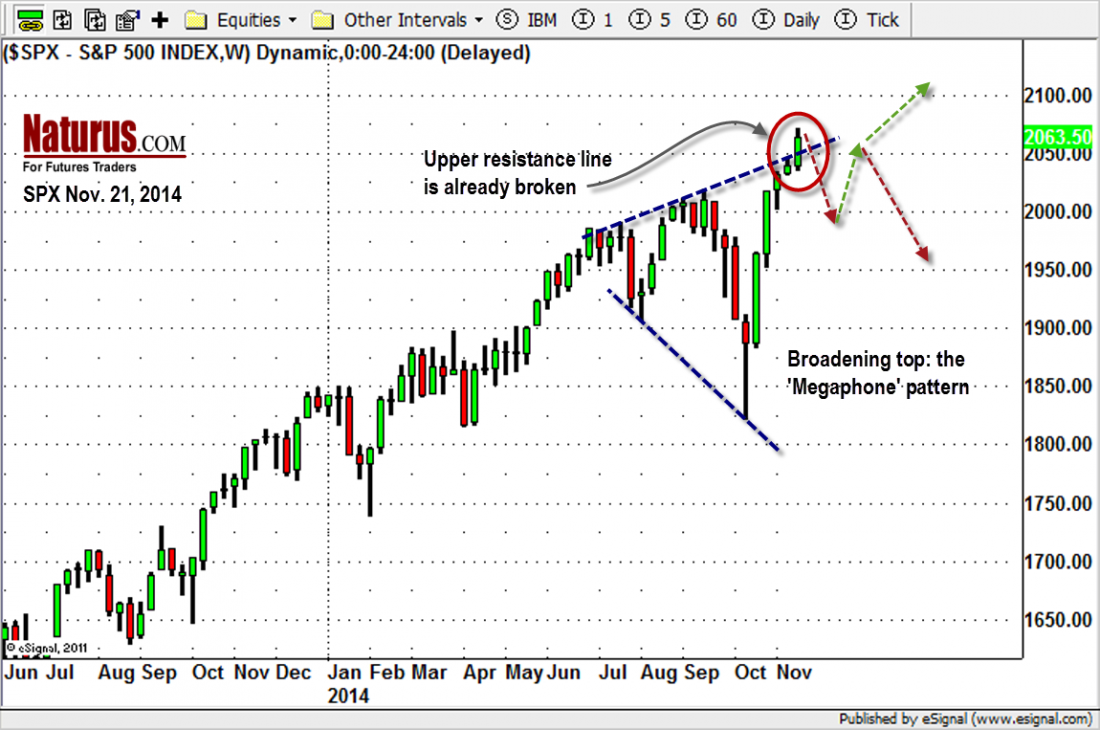
The “megaphone” is market shorthand for a broadening top pattern on the charts. (See below). It is formed when the market makes a succession of higher highs punctuated by lower lows over an extended period of time, so it looks like a megaphone. It is narrow at the beginning, but getting wider – and wilder – all the time. It is a series of wild price swings, just like we’ve been seeing in the S&P since September.
These broadening tops are a little bit rare. There was one in the NASDAQ at Thanksgiving 2009, for example. These tops are usually regarded as a bearish pattern, and they are usually followed by a break out of some kind. The problem is the break-outs tend to be pretty random.
Thomas N. Bulkowski, who literally wrote the book on chart patterns, has been gathering data on the megaphone (and other chart patterns) going back to the last Great Depression. His conclusion is they don’t have much predictive power. They break out to the upside 49.6% of the time and to the downside 50.3% of the time, which is as close to random as anything the market offers.
The one thing that tilts this megaphone a bit to the upside is that it has already broken the top boundary of the pattern. A fairly typical development now would be for it to pull back inside the pattern and then bounce up.
As it happens, there is a reasonable target for a pullback – the unfilled gap at 2051 created Thursday night when the market broke up on the news of a rate cut in China, and a new bunch of promises (threats?) about quantitative easing from the European Central Bank. The fact that the gains quickly melted away is one more thing that makes us nervous.
How To Trade It
Frankly, we’re not sure you should trade this one. This market has the potential for a bit more upside and a lot of downside. And we’re going into a short week when many traders will pack it up by noon Wednesday and take off until Monday morning. By Wednesday afternoon the volume will drop dead.
Thin volume in a heavily over-bought market is a recipe for volatility, and we will be very cautious about initiating new positions this week.
For short-term day trades, the S&P500 mini futures (ESZ4) finally found support around 2050-55 on Friday. If you fear nothing, that would be an entry point for a cautious long trade with a target around 2060.
On the other side, a break below 2048 could easily send the futures down to 2040-2035. If/when we reach that level, we will see buyers coming back into the market. That’s the long-side trade. But the buyers may not show up until Monday. Can you wait that long?
S&P500 Cash Index Weekly Bars.
#####
For more information on Naturus.com, click here.

