

Candlestick charts have often been used to identify market turning points and pivots. However, they can also be used to help identify when new price-action momentum is starting to generate new breakout signals, using several simple patterns for intraday and swing trades.
Using the size of daily or 60-minute candlestick charts can reveal emerging buying strength, and can help astute active traders quickly scan for potentially strong breakout patterns. The key is to look for what the candle pattern is telling us, in terms of increasing versus decreasing price momentum over time.
WIDE-RANGE BREAKOUT CANDLE ENTRY SIGNAL
A favorite swing trading scanning approach involves looking at a series of three or more candlesticks in a row, to determine whether or not new buying (or selling pressure) is entering the chart.
In Figure 1, DIS (Disney), you can see that after a narrow candle followed by wide candle in an uptrend, the price action continues up sharply for a breakout continuation swing trade.
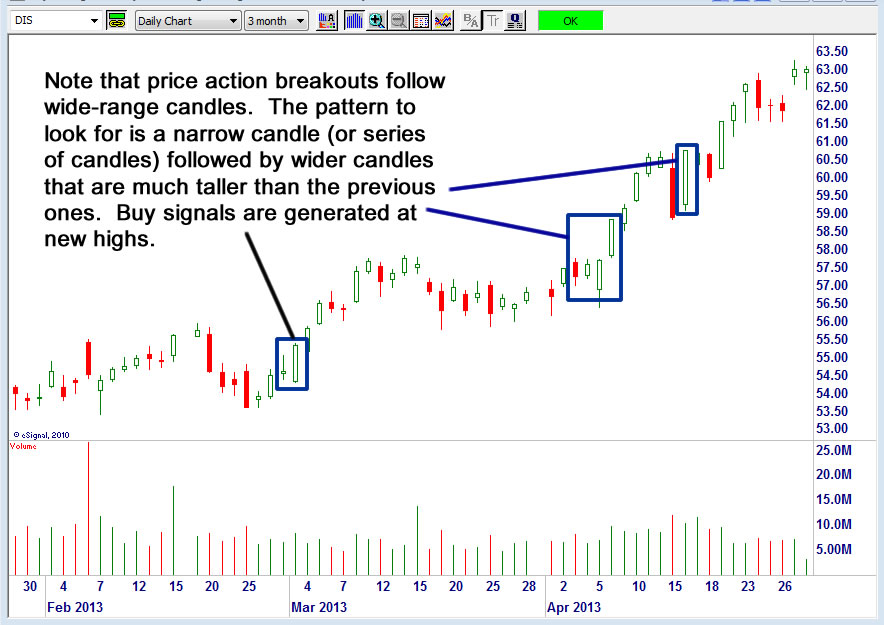
Many traders get into trouble by overtrading choppy charts. The rationale for this wide-candle approach (in which the wide-range “signal” candle should be at a new high) is that wider range trading days are often clues that institutional buyers are entering their trades.
It’s often good to look for a wide-range candle that’s at least 30-50% higher than the prior candle, doing so on higher-than-average volume. The buy signal is generated on the day following the wide-range candle, above the prior day’s high for an entry.
What makes this approach an effective one is that it’s very simple to use. Traders can simply visually scan for wide candles in an uptrend, and look for new highs on three-day high wide range candle patterns. The goal is to stay out of choppy low-volatility “flat” candles with narrow average trading ranges, and instead enter only on continuations following the “proof” of buyers following a wider-trading range day.
On the chart, wide candle patterns pop out and are easily visible. Maximum stops on day trades should be ten to forty cents, and maximum stops on swing trades no more than $1.50 from the entry. Trades can be added to by scaling in on continuation moves following wide-range candle days as well, for a more advanced professional trading approach.
MOMENTUM SWING TRADING CUPS AND CANDLESTICKS
Trading an inside-range breakout is one professional strategy that active traders can use to capture breakouts that occur inside prior trading ranges. In Figure 2 (KMX, CarMax, Inc.) there’s a combination of both a wide-range candle as well as a bullish cup pattern.
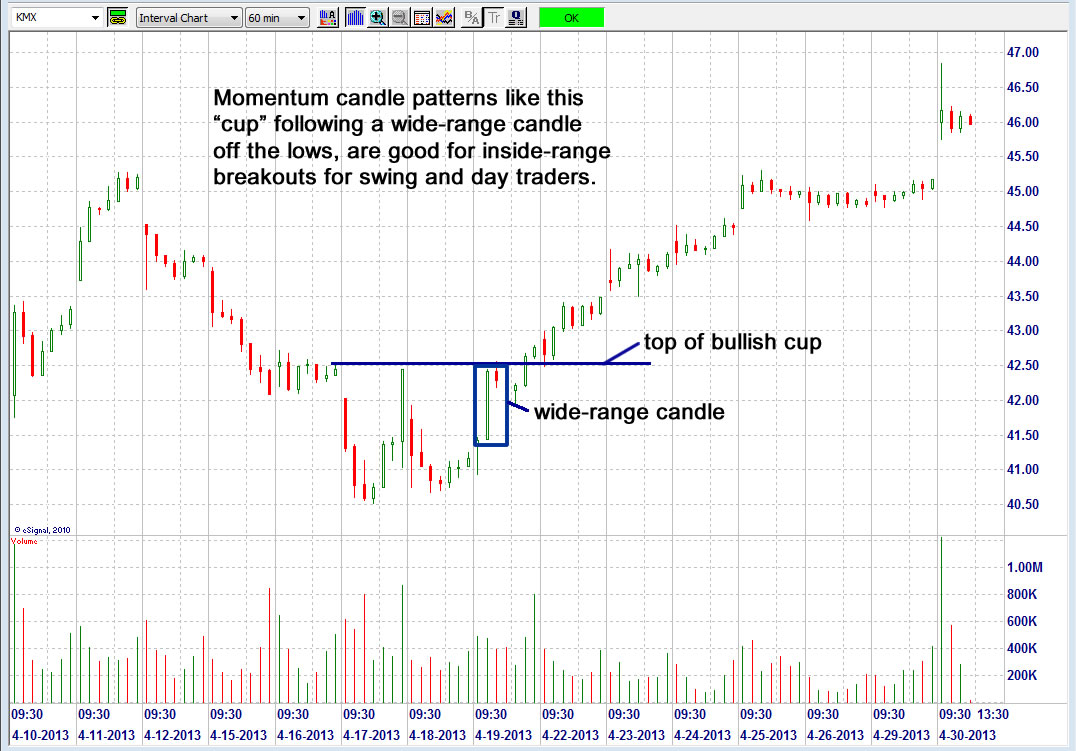
Combining these two patterns can provide a strong breakout signal on moves over the cup pattern high, as seen at 42.50 in this chart. The key is to use resist the temptation to guess at lows or pivots, and instead wait until after a wider range candle, as shown in the KMX chart. It seems that many traders lose a lot of money by trying to outguess the charts, and place their trades at the first (weak) sign of a bounce.
Instead, as you can see from the momentum price-action in this chart, there’s ample opportunity to capitalize on a strong candlestick breakout after the buyers have “jump started” the price action, in this case above 42.5 for a continuation breakout run.
PUT IT ALL TOGETHER
When looking for candlestick chart breakout signals, combine them with western technicals, like increasing volume and bullish cup breakouts (for longs), to spot the strongest entries in today’s markets.
= = =
Ken Calhoun is the producer of multiple award-winning trading courses and video-based training systems for active traders. He is a UCLA alumnus and is the founder of TradeMastery.com and DaytradingUniversity.com and has coproduced StockTradingSuccess.com with colleague Steve Nison.

