

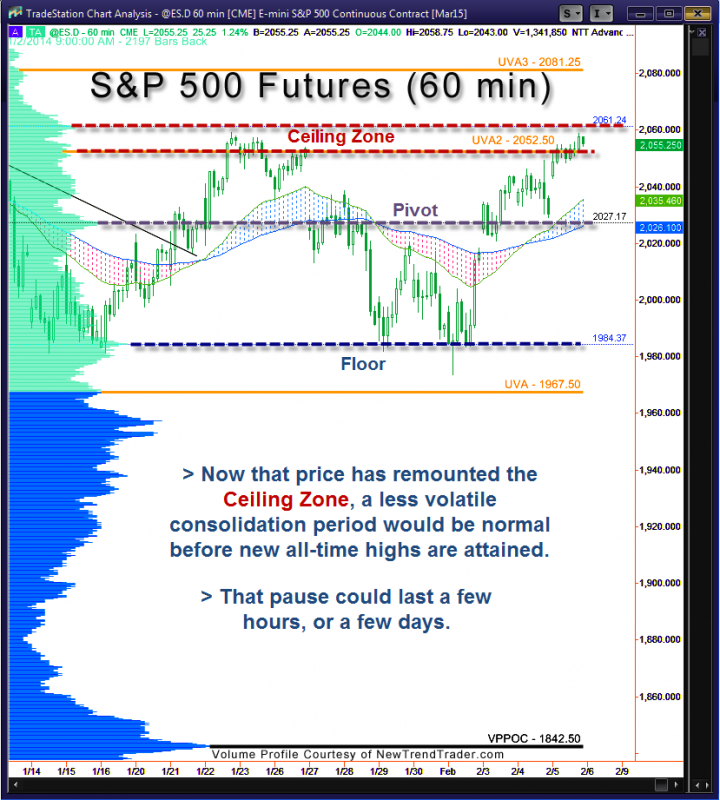
The market felt no need to address the gap at 2018.50. Instead, it fulfilled its destiny and arrived comfortably inside the Ceiling Zone (2051-2061).
A less volatile period of consolidation would be normal here before an assault on new all-time highs. The pause-that-refreshes could last a few hours or a few days.
A Note on Volume Profile
The histogram on the left side of the chart shows the volume distribution in the S&P futures for the entire year of 2014 through today. Key levels are indicated by the peaks and troughs.
#####
If you would like to receive a primer on using Volume Profile, please click here.

