Weekly and Daily.
Interesting charts in here.
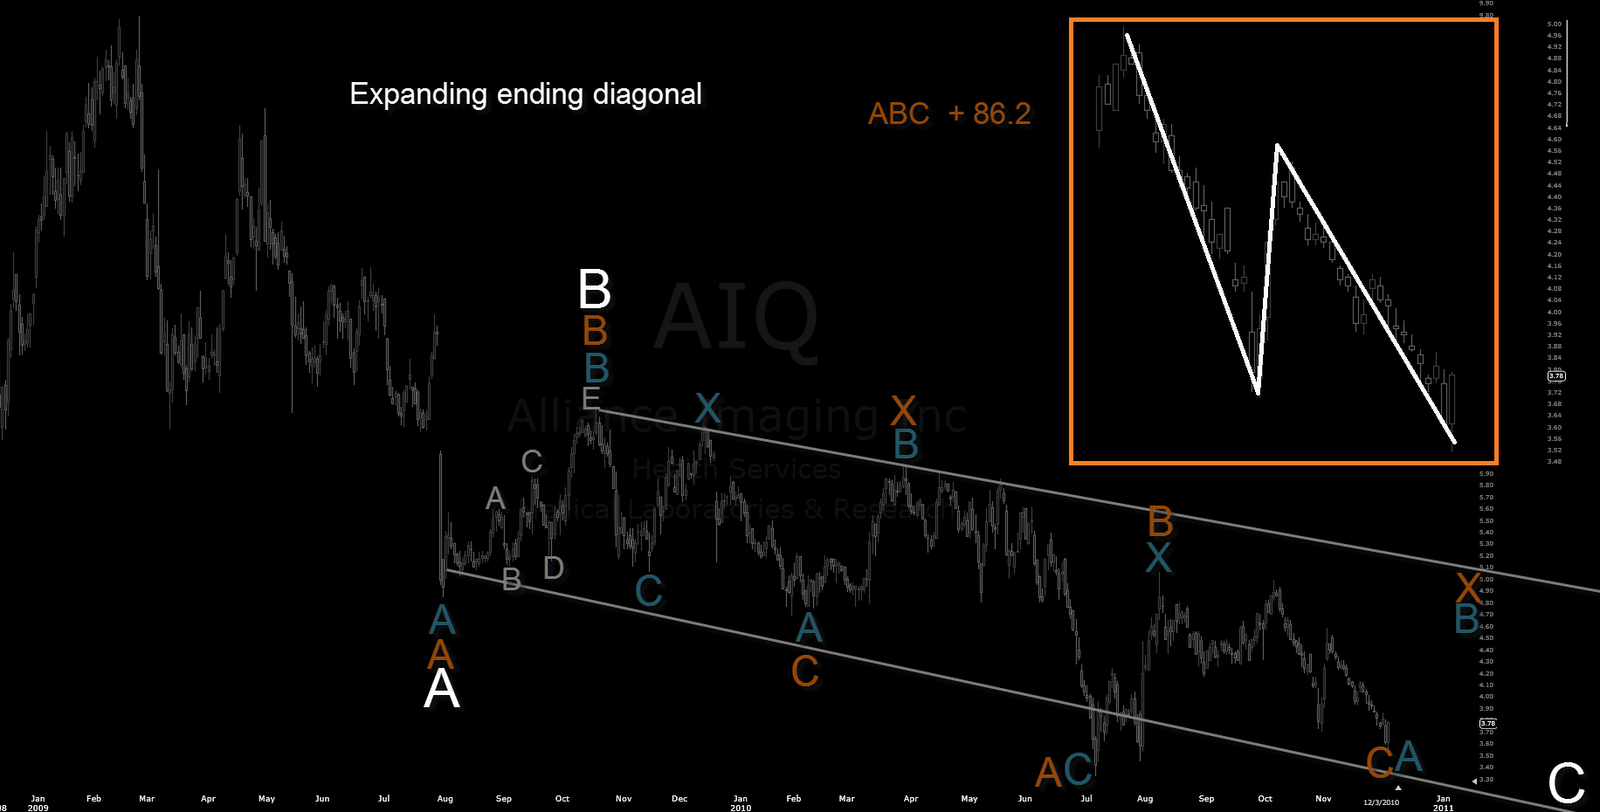
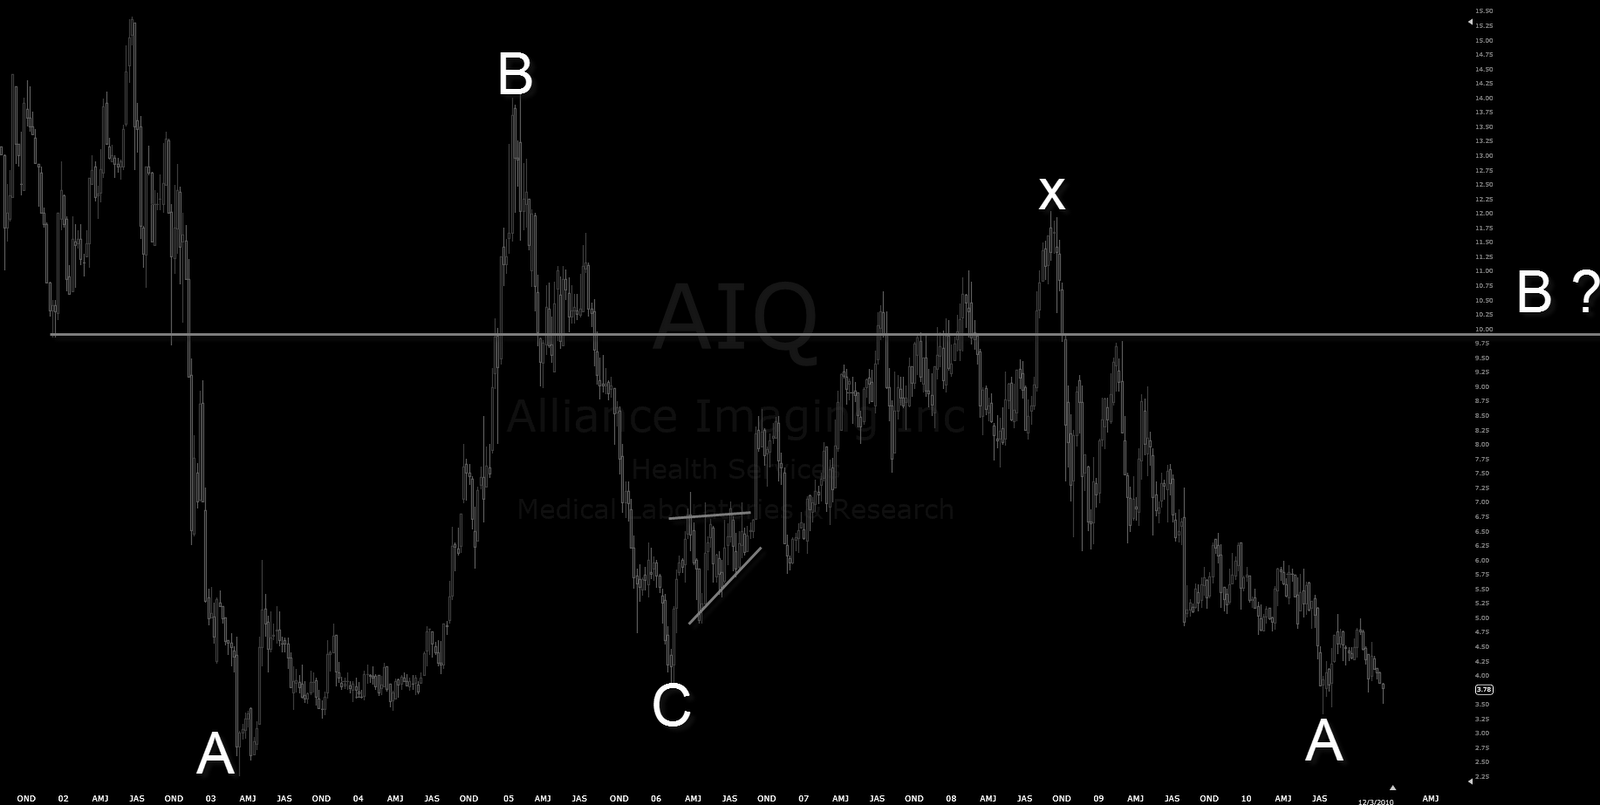
3 waves down for B wave territory ie. 86.2% where weekly chart suggesting also only zigzag impulse.
In harmony world this 5-a-b section is own pattern called bullish bat.
Running correction ?
Edit; Bearish Alternate for Bullish chart. Something is trying to come out from there anyway.