
Throughout my years as a pro trader and chief market strategist, I have studied the markets, looking for keys, strategies, new findings. As a company, my partners and I have developed some of the best working and profitable proprietary techniques for trading, swing trading and longer term investing. We formed the company to enlighten and help the average investor bypass all the Wall Street hype and nonsense and in essence, try and even the playing field. I am writing this to help each and every one of our readers and loyal followers try and increase their profits and winning trade percentage. We all know trading is an extremely hard career, at InTheMoneyStocks.com, we truly hope we give you all a greater chance of succeeding and making the dream a reality.
I am going to go over one of my secrets today in regards to small caps. I am famous for picking and finding small caps that are near a breakout or about to make a major run. The trader’s in our Intra Day Stock Chat and Research Center which features the Hidden Gems will attest to that. My partner and I have studied charts like no one else. We look for every indicator and try and find whether or not each major move in a stock was somehow choreographed prior to it happening. As I have studied the charts of small caps and watched the level II closely, I picked up many keys. Today I will reveal one.
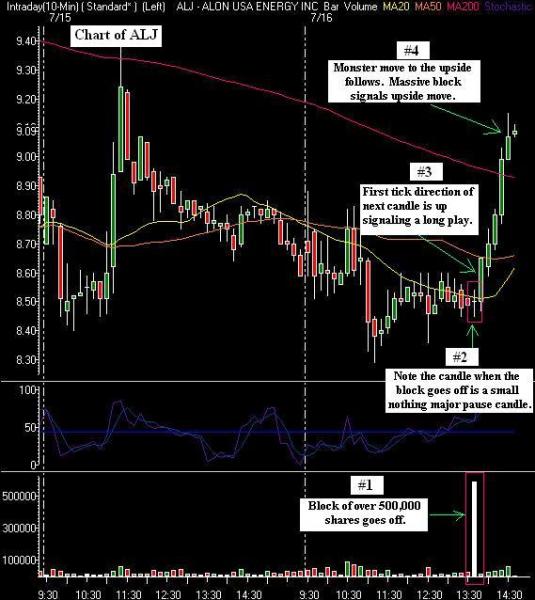
This technique I use, tells me if a major move is coming, either higher or lower on a small cap. We call it the InTheMoneyStocks.com Block Tick Blast play or BTB play. As we all know, small caps generally trade lighter volume and are extremely risky in nature. As I sit and trade daily, weekly, monthly and yearly, I watch for blocks to go off on small cap plays. When I talk about a block, it is important to remember that it needs to be an extremely large size. In essence, it needs to be at least half the daily volume of the stock in one block trade. Remember, I am not saying that many trades can equal half the volume of an average day in one candle, I am saying…one trade that equals half the daily volume. That will basically alert you it is an institution/hedge fund getting involved. To give an example, a stock trades 500,000 in average daily volume. One print/trade must go off at a minimum of 250,000 shares if not more.
The next key that must be analyzed is where the stock is currently trading. The stock should not be trading at the highs or lows of the day and not up more than a few percent on an intra day basis. In addition, the stock should not be trading at or near 52 week highs if this is taken as a long play or at 52 week lows if this is taken as a short play. Generally, I take this trade to the long side and look for stocks near their 52 week lows.
As we put the keys of this trade together, we must also start to look at the positioning of the candle when the block goes off. The block trade should be initiated and completed in generally a pause candle on the intra day chart inside of a pause tight trading range day. For instance, a stock has been trading in a twenty-five cent range all day with nothing exciting going on, drifting one way or the other. All of a sudden a huge block is put through at current price. Basically, what you are looking for is a block to go off on a stock that has no interest in the bullish or bearish direction. Think about it as an institution looking to be the first one in when no one is looking before they run it.
Now the next part is extremely important. When that block goes off and all the aforementioned rules align, the direction of the next candle on the 10 minute or 5 minute chart is key. Does the next candle start to tick up or down? I have always traded it in the direction of that first candle following the block. I have found that whichever way the stock starts to tick following the block is the direction it is going to go. I will generally jump on that side and let the momentum carry the stock with me in it.
As always, a stop and exit strategy must be used. While this trade has an extremely high success rate, nothing is 100%, as all us traders/investors know. If the block goes off and the stock starts to rise, I will jump long and begin the ride. You can see the charts below with the size of the move that can be expected. However, every once in a while the move will not continue. That is why a stop must be used. In general I will use a mental stop so the market makers and computer programs in thinly traded stocks will not take me on purpose before running the stock in the direction I wanted. Should the trade start to up tick, I jump long, however, after a small move up, if the stock begins to slowly come back down, I will do one of two things. I will either use a 3% stop if it falls quickly or, if it is slower, then a close of that 10 or 5 minute candle lower than the block was printed at is an indicator of failure and I will exit the trade.
Look at the charts below to see how this works. It is truly amazing.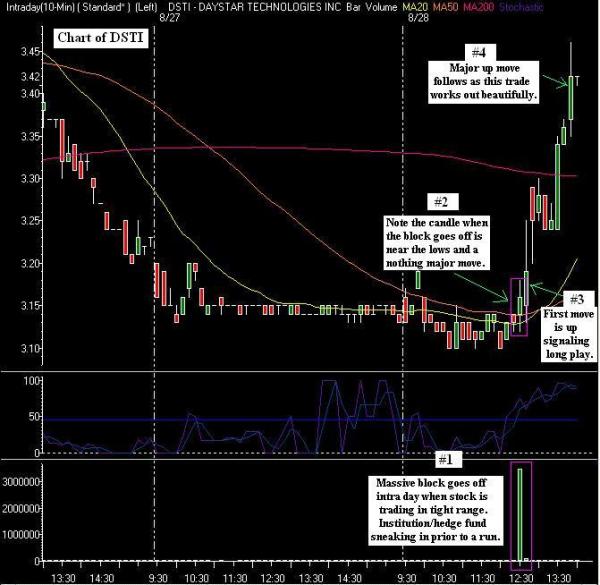
By: Gareth Soloway
President &CFO
Chief Market Strategist
InTheMoneyStocks.com

