

The Australian dollar is often viewed as a bellwether for U.S. equities, largely due to its economic sensitivity and the country’s industrial ties to China.
RECENT ACTION
Over the last month the Aussie dollar ($FXA) has been experiencing some weakness, dropping 5% in April. Let’s take a look at some of the earning warning signs that lead to the drop as well where the Aussie dollar could be heading.
While the drop has been quick, there are some signs we can look at that foreshadowed the move and help us examine future charts of not only the Aussie but other securities as well. In early April the Currency Shares Australian Dollar ETF ($FXA) attempted to break above resistance set over the previous twelve months at $105.
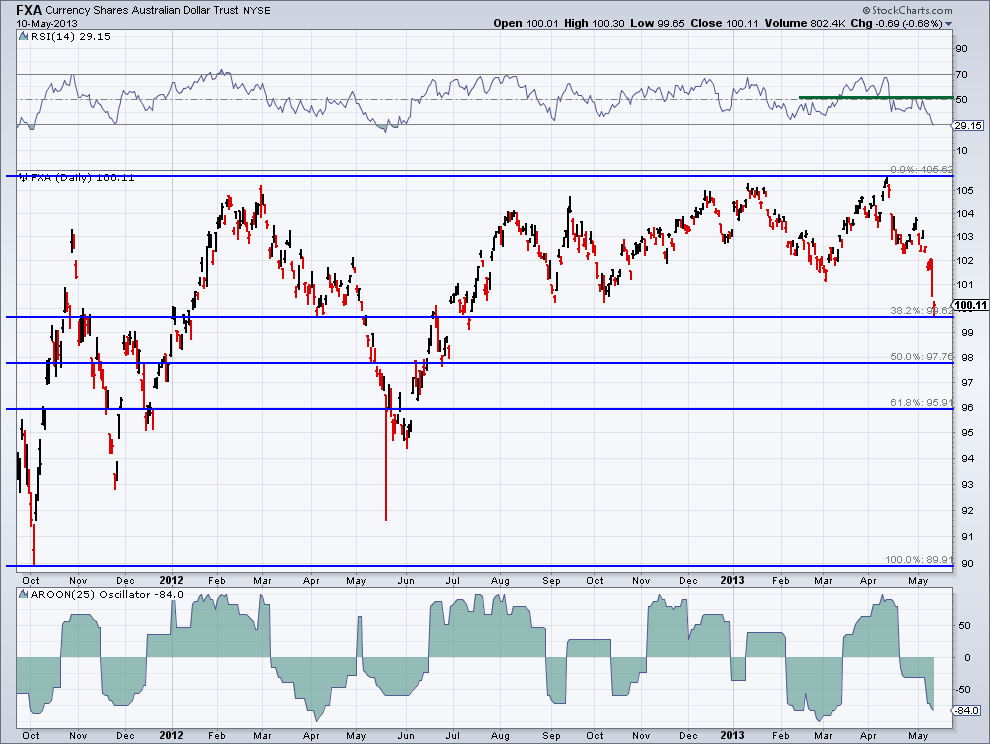
This is likely where buyers were looking for a clean break and potential for continued price appreciation, however once the pop occurred prices quickly retreated. Hindsight is a beautiful thing, and is the only true way to recognize a false breakout. However, we can see that momentum (based on the Relative Strength Index) during the $105 break did not hit new highs along with price. Nor did bulls push momentum to an overbought status, which would have been positive for $FXA as a sign of strength. Instead we had a slight negative divergence, which price eventually mirrored.
Price eventually retreated to under $103.50 before seeing a few days of strength. Keeping our focus on the RSI indicator we can see that it bounced back to the 50 level, but was unable to break above – a bearish momentum sign. $FXA bulls were not strong enough to maintain bullish momentum and price reflected this by continued to drop.
During this decline we saw the trend shift, based on the Aroon Oscillator, which is often used as an ‘early warning detector’ of trend changes by comparing price to previous highs and lows over the past 25 days. Over the last month the downtrend has increased, with the Aroon Osc. continuing to retreat.
KEY LEVEL NOW
The Australian dollar now finds itself at the 38.8% Fibonacci Retracement level of $99. In March of last year price found support at $100 before eventually sliding down to $94. We also saw the $100 level also as support in September and October of last year.
Furthermore in the bulls favor is the latest COT data, which shows the commercial traders (often referred to as the ‘smart money’) taking their position in the Aussie dollar to nearly net-long. We saw the same type of bullish COT data in late-February of this before $FXA rose from $101 to $105. However, commercial traders did not keep the train rolling and pulled back their bets on the Australian dollar right before prices contracted. Commercial traders spend most of their time net-short the Australian dollar as they hedge other currency-sensitive long positions. Conversely, when they do become buyers of the Aussie currency, like they did in July 2010 and May 2011, attention should be paid.
We’ll see if buyers can hold this Fibonacci level and if the ‘smart money’ continues buying or if the bearish momentum and trend change continue to take prices lower.
Disclaimer: The information contained in this article should not be construed as investment advice, research, or an offer to buy or sell securities. Everything written here is meant for educational and entertainment purposes only. I or my affiliates may hold positions in securities mentioned.
= = =
Read more analysis by Thrasher here.
= = =

