
In my Morning Call and Daily Recap videos, I almost always cover Apple Inc. (AAPL) because of its massive importance to the indices as well as its currently undervalued price level. For active technical traders, AAPL also generally trades very well in both directions, although I tend to almost always have an upside bias for the stock.
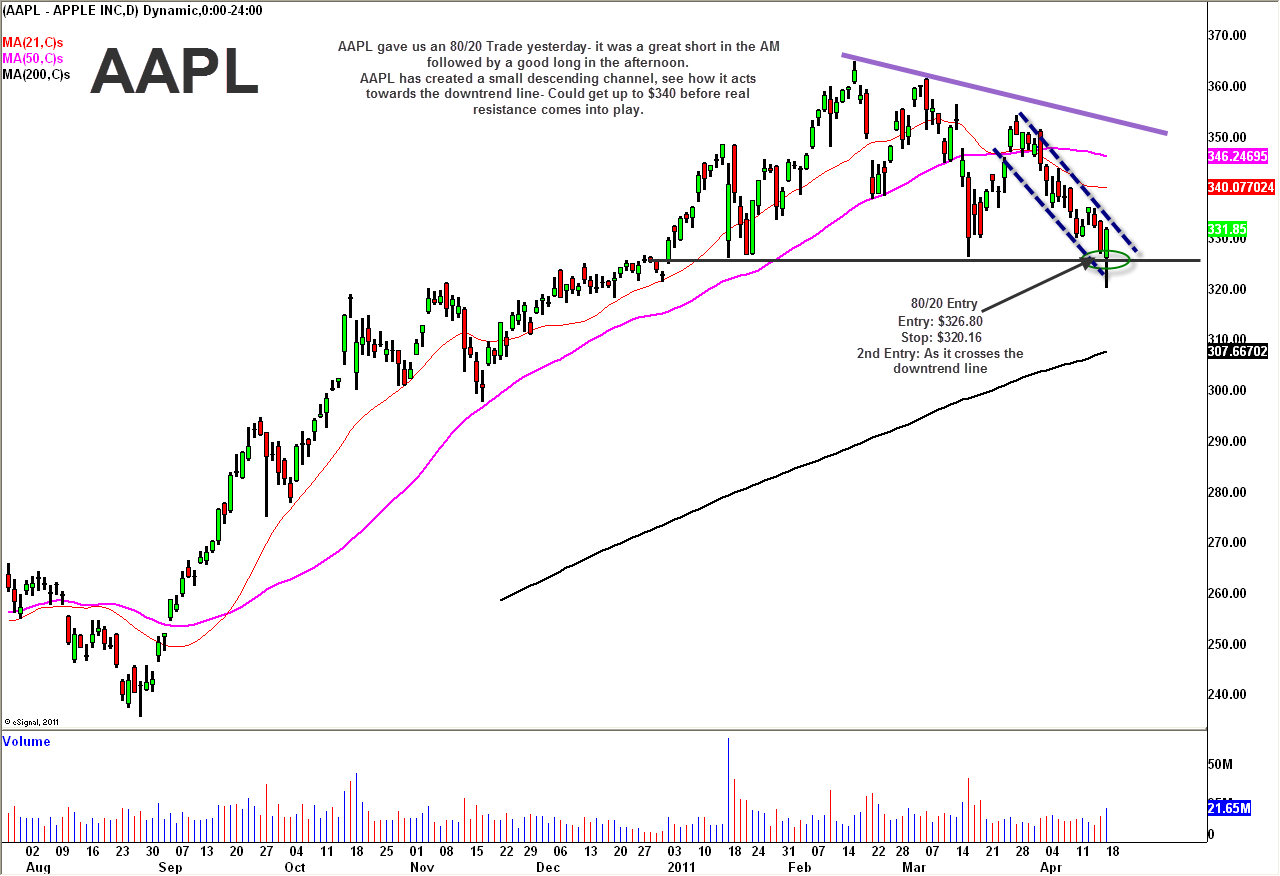
For educational purposes, I would like to draw your attention to the chart we sent out with the Morning Call on March 18th. This was an example of a RedDog 80-20 Reversal trade, in which an oversold stock trades down through support and back up above the previous day’s low. Apple had been under pressure due to Steve Jobs concerns, supply chain questions in Japan, and index rebalancing, but it was hard to envision the stock staying down for long. The iPhone, now also on Verizon, is still leading the smart phone market while the iPad has been a relative hit among mainstream consumers.
For more on how to trade AAPL after earnings, watch the segment from the Morning Call below.
The reversal strategy was the following: When AAPL pierced $326.80, lots of longs got stopped out. At the same time, shorts started to load in as the stock traded with momentum down through a key technical level. When the stock reversed back above that level, those same short likely covered and some traders may have gotten back into stock. Technical levels are areas of heightened volatility that can often end in a tug of war, but in this case AAPL showed that the bulls are still in control of the stock.
The strategy is you buy $326.80, put a stop at the low of the that day (in this case $320.16) so you have a six dollar risk on the best stock in the market that pulled of 45 points from its highs.
Everyone uses this strategy differently. Some quick traders sold the next day around $335 for about 10 bucks of profit. Some may have said “I’ll hold until earnings since I don’t take stocks into earnings” which they could have sold around $340’s where we indicated it would see some pre-earnings resistance. Those that had a more long term view and were willing to perhaps endure pain in AAPL post earnings if they needed to held into earnings and have been handsomely rewarded after a monster earnings report.
Short term, the next technical area to watch will be $360-364.90. I’m hoping it doesn’t get through there today, but sells down a bit. Then with some time it creates another trading pattern in order to get a great entry for a breakout to new highs.
Below is the chart from April 18.
*DISCLOSURE: No position in AAPL
This material is being provided to you for educational purposes only. No information presented constitutes a recommendation by T3 LIVE or its affiliates to buy, sell or hold any security, financial product or instrument discussed therein or to engage in any specific investment strategy. The content neither is, nor should be construed as, an offer, or a solicitation of an offer, to buy, sell, or hold any securities. You are fully responsible for any investment decisions you make. Such decisions should be based solely on your evaluation of your financial circumstances, investment objectives, risk tolerance and liquidity needs. Visit the T3Live Homepage, Virtual Trading Floor, and Learn More About Us.

