

In the past two years the U.S. Government has added approximately 10% more to our deficit, so why did the price of gold recently fall 40% and silver fall 60%. Is the price really tied to how much money we are borrowing or printing? Or is the price tied to supply versus demand?
Or, is the price of gold and silver manipulated?
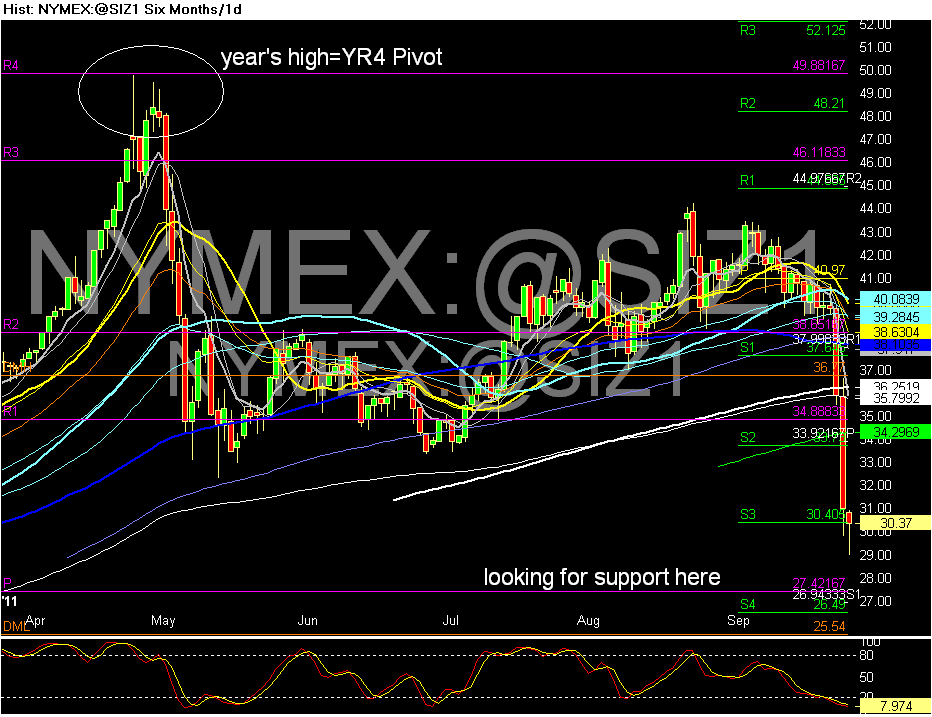
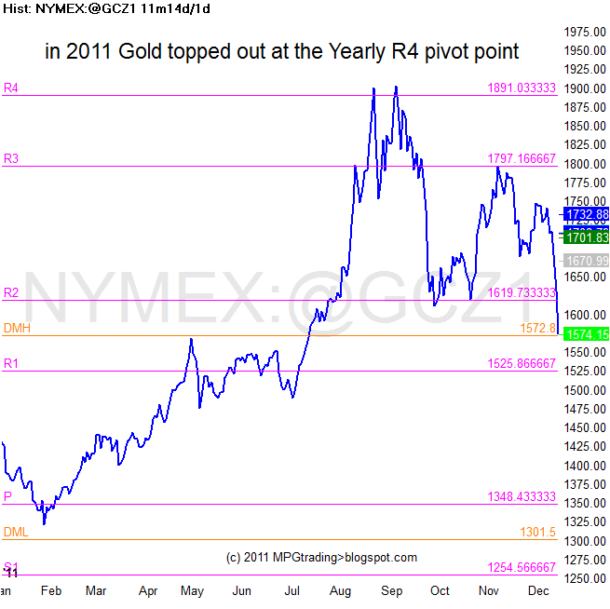
Let’s look at some price charts and you can decide. The all-time high on gold and silver was in 2011 at their Yearly R4 pivot points (see Figure 1 and 2).
Remember, the big banks (GS, JPM, MS, UBS, etc) and institutions use Yearly pivots to buy and sell at. They run the price up to them, then sell their position and short it back down to the support pivots. Interesting how both gold and silver’s rallies stopped exactly at their YR4 pivots in 2011? Manipulation? Coincidence?
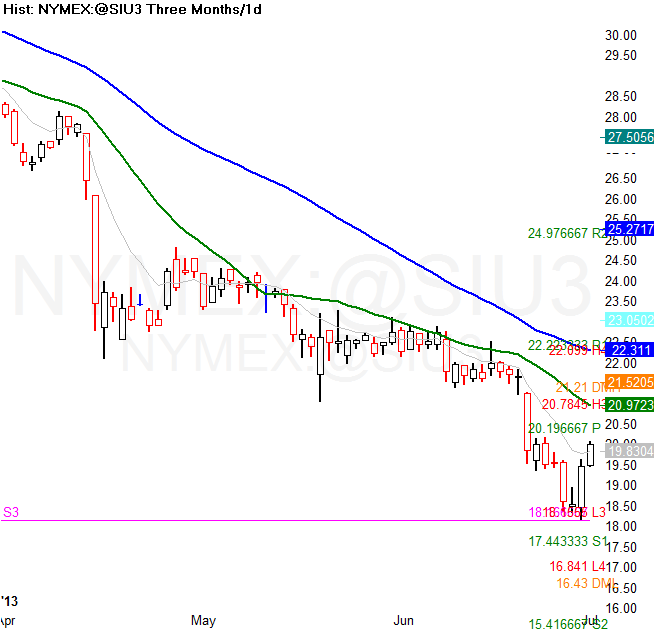
The past few weeks the big Wall Street banks started covering their short positions on the 2013 Yearly S3/S4 pivot points. September silver futures bounced to the penny on its Yearly S3 pivot point (see fig. 3). And August and December gold futures bounced off its Yearly S4 pivot points (see fig. 4). Another coincidence that this year’s lows are on the Yearly S3/S4 pivots? Our deficit is going higher, not 40% lower. Price Manipulation?
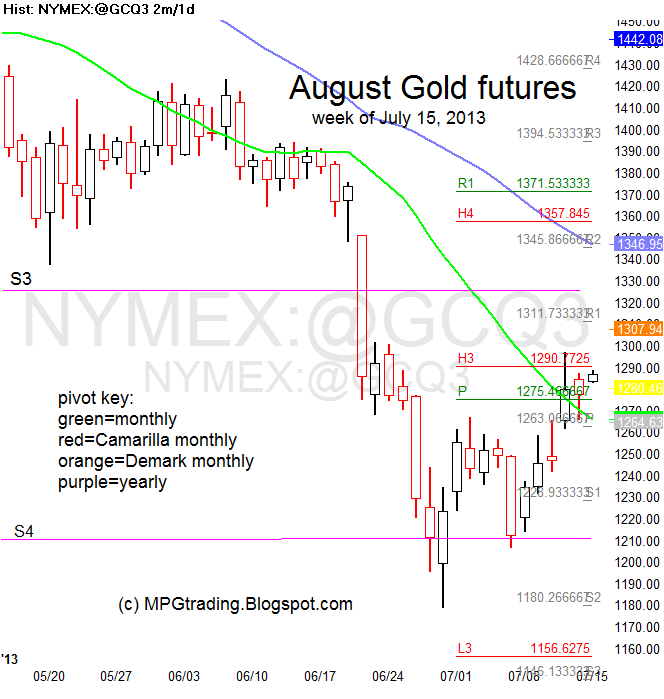
Using pivot point analysis, I feel the worst is probably over for this year. We could bounce back up to the monthly 50/Yearly S2 pivot at 1426, sometime this year. Or retest the lows. The monthly chart on gold looks really ugly. There is a lot of technical damage done. This is not just a correction, it is a major breakdown of a long trend. The banks have many gold bugs (Peter Schiff, etc.) trapped at much higher prices. The banks will probably squeeze these folks for many years until they capitulate or go broke.
BOTTOM LINE
That’s how Wall Street banks make money—they trap novice traders/investors.

