Yoda’s Voice Still Haunts my Dreams
Over the years I’ve sent my work to an aloof mentor of mine, something of a Yoda of the markets who was acquainted with Jesse Livermore’s wife back in his day and ultimately learned to earn fortunes by spending more time out of the market than in it.
There are two things for which I owe him my deepest gratitude. The first is the ruthless damage to my ego. It was a necessary step to becoming a better analyst, and remains essential to my being worthy of my clients’ business.
CONTEXT IS KEY
The second is his refrain that still haunts me:“Context!”
I refer to it by asking what the current price structure plays in the role of the larger trend. It applies to all degrees of trend: what an intraday wiggle means to a long swing trade; what a 10% drop means for an investment with a time horizon measured in years.
In this piece, I address the context of the secular trend since 2000. Based on this analysis, I’m advising investors at miAnalysis to assume a more conservative allocation and position traders to be square for the time being (while positioning for rising trends in the euro’s value to the dollar and U.S. Treasury prices through ETFs that pace them).
SECULAR VERSUS CYCLICAL
Secular trends last 10 years or more and define the era: 1929-1942 Bear (the Great Depression and aftermath); 1942-1966 Bull (post-war recovery); 1966-1982 (Vietnam, Nixon scandal, energy and hostage crises); 1982-2000 (technology bubble); 2000-present (bursting of tech and housing bubbles). Within secular trends are cyclical trends (moves of at least 20% higher or lower) that discount changes in the business cycle. A study of the period from the late 1920s to the presents shows the average cyclical bull market in the Dow Jones Industrial Average spanned four to five years.

LOOK TO HISTORY AS A GUIDE
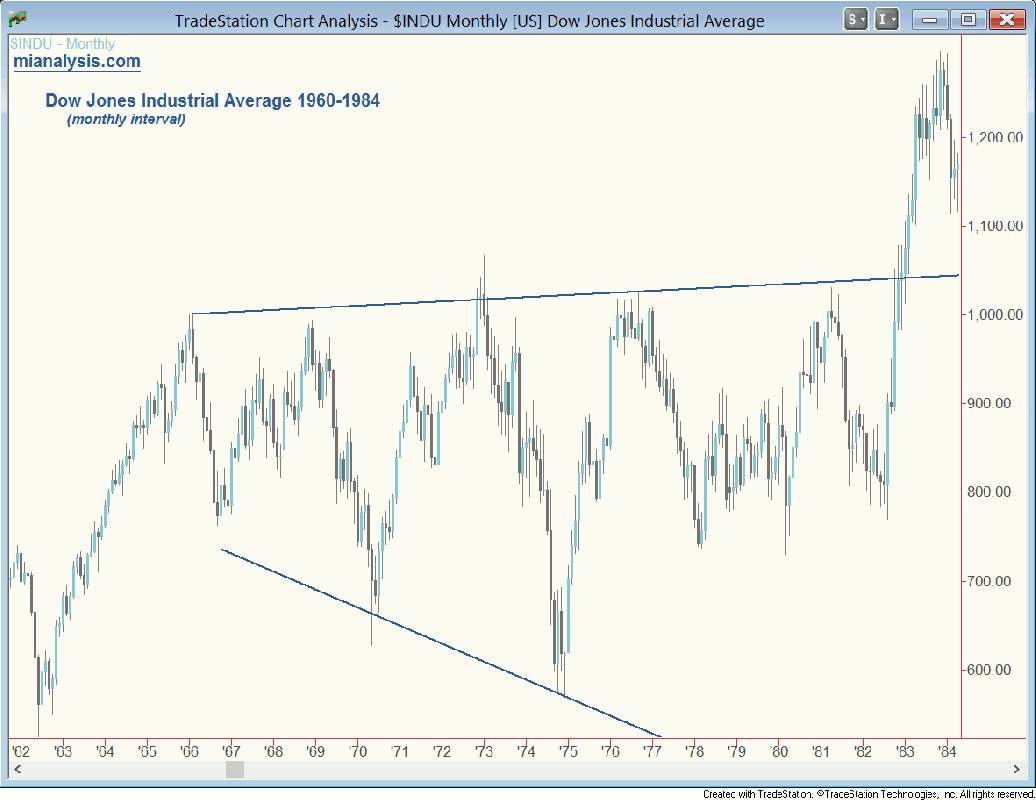
Although history generally doesn’t repeat in exactly the same ways, we can learn a lot about the present by observing the past. Figure 1, above shows the Dow Jones Industrial Average in the secular bear during the 1960s and 1970s. The lines I’ve drawn denote a large broadening formation. Note that the Dow reached a new high in 1973 but that didn’t change the role of the price structure, which was still corrective in the coming years until 1982.

THE PRESENT CONTEXT
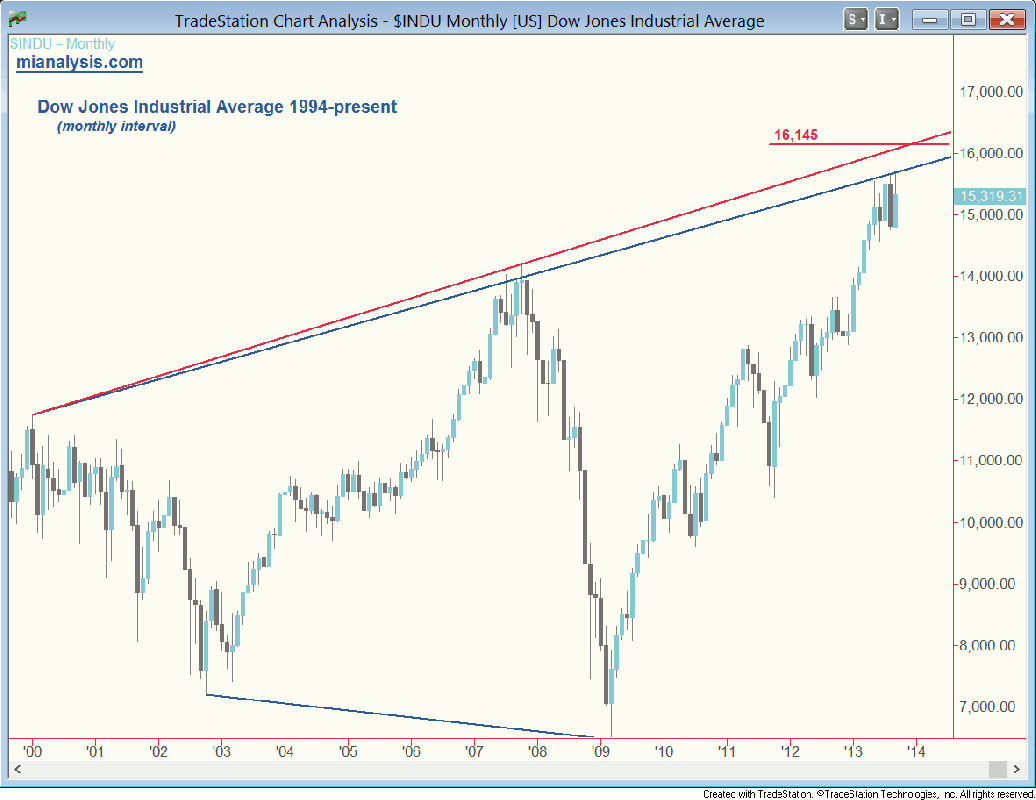
Now observe the Dow of the past 13 years. It shows a less complex but similar broadening formation, and price is at or near the top of it. Here too, although the Dow reached new highs, it’s arguably still in a corrective phase on a secular level. The upper barrier could be drawn in two ways, as I’ve indicated in the blue and red lines. If the red line ended up acting as the ceiling, it would meet a Fibonacci extension target of 16,145 by early 2014. That 138.2% of the 2002-2007 cyclical bull, added to the 2009 low.
WARNING SIGNALS
The recent congestion in the Dow shows some warnings in the candlesticks. The May candle shows a bearish upper shadow. The two candles to August complete a bearish engulfing pattern. As we get closer to the end of September, this month’s candle is set to show another upper shadow. The implications are that higher prices are being rejected. One point I’d add here is that you shouldn’t disregard the bearish candles if the Dow does reach new highs. In my experience, bearish reversal patterns often lead at peaks because institutions sell gradually, into strength.
WHAT’S NEXT?
It’s highly unlikely that price will make it to or beneath the 2009 low. The severity of the drop that led to that point was similar to the 1974 low that was the nadir to that secular bear. That time around, stocks struggled to recover in the years that followed and only begrudgingly moved into the next secular bull in 1982. In contrast, the bounce off the 2009 low was nothing short of spectacular. Why? You guessed it: the Fed.
But that doesn’t eliminate the risk of one more cyclical bear before stocks move into the next secular bull. And the position of the Dow at the top of the broadening formation, amid evidence of new highs attracting selling since May, heightens that risk. So does the possibility that the cyclical bull since 2009, now in its fifth year, is mature.
If you’ve made it this far, I thank you for your attention and hope I’ve given you something to think about. All the best from me and the miAnalysis team, Chris Burba.
#####


