
By: Zev Spiro
Alliant Techsystems Inc. (ATK) was in deeply oversold territory this past summer and rallied approximately 33% from the July lows to early November highs. The rally stalled at resistance, which came from a major down trend line. A symmetrical triangle pattern began forming directly below the long term down trend line. Due to the cluster of resistance, from the upper boundary line of the pattern and the long term down trend line, an upside breakout would be extremely significant. Once the pattern triggers, 86 dollars is the minimum expected price objective, based on the height of the pattern.
Chart 1: This weekly chart illustrates the symmetrical triangle that has been forming directly below a long term down trend line.
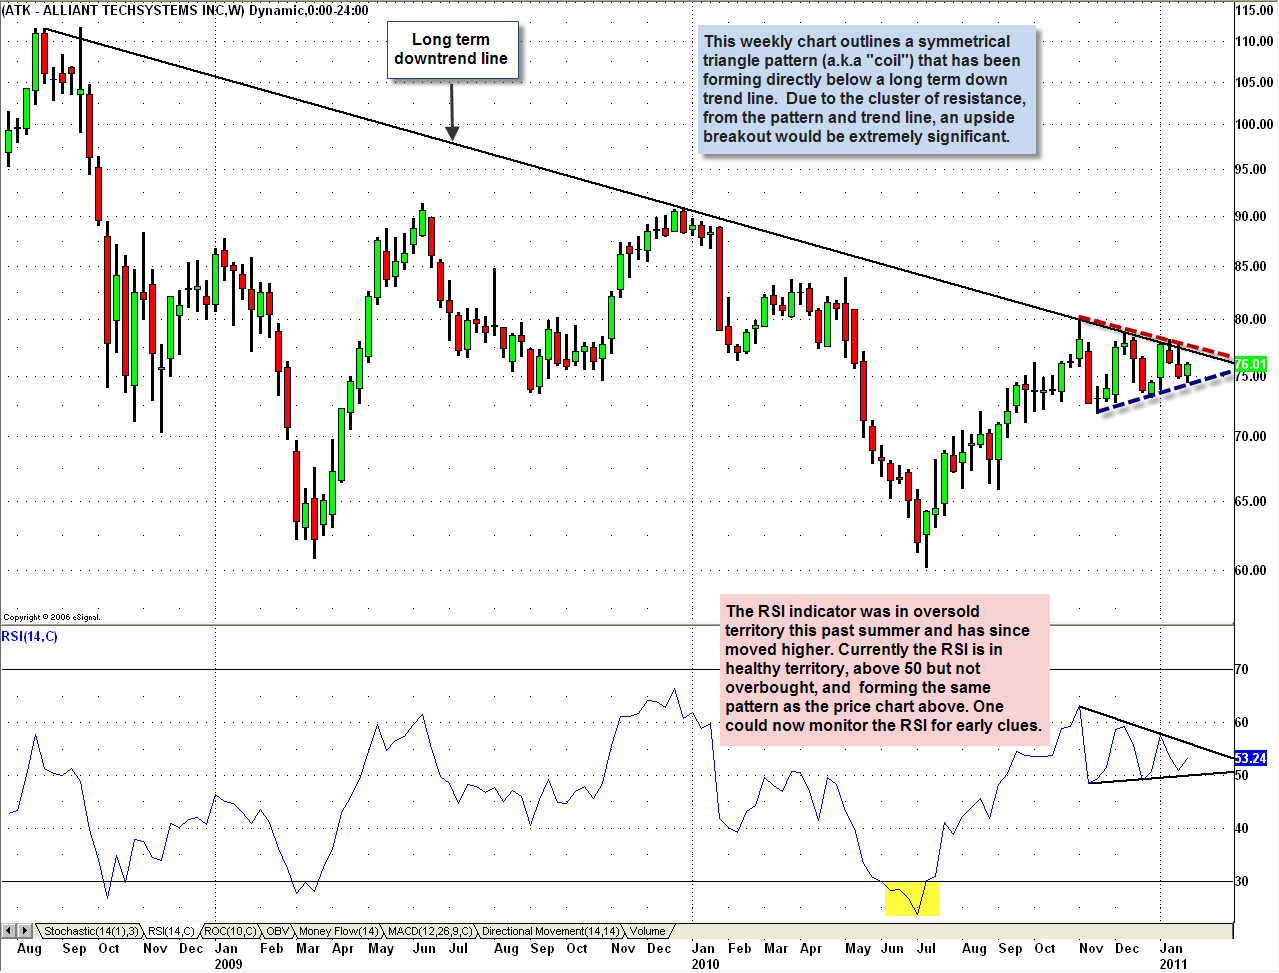
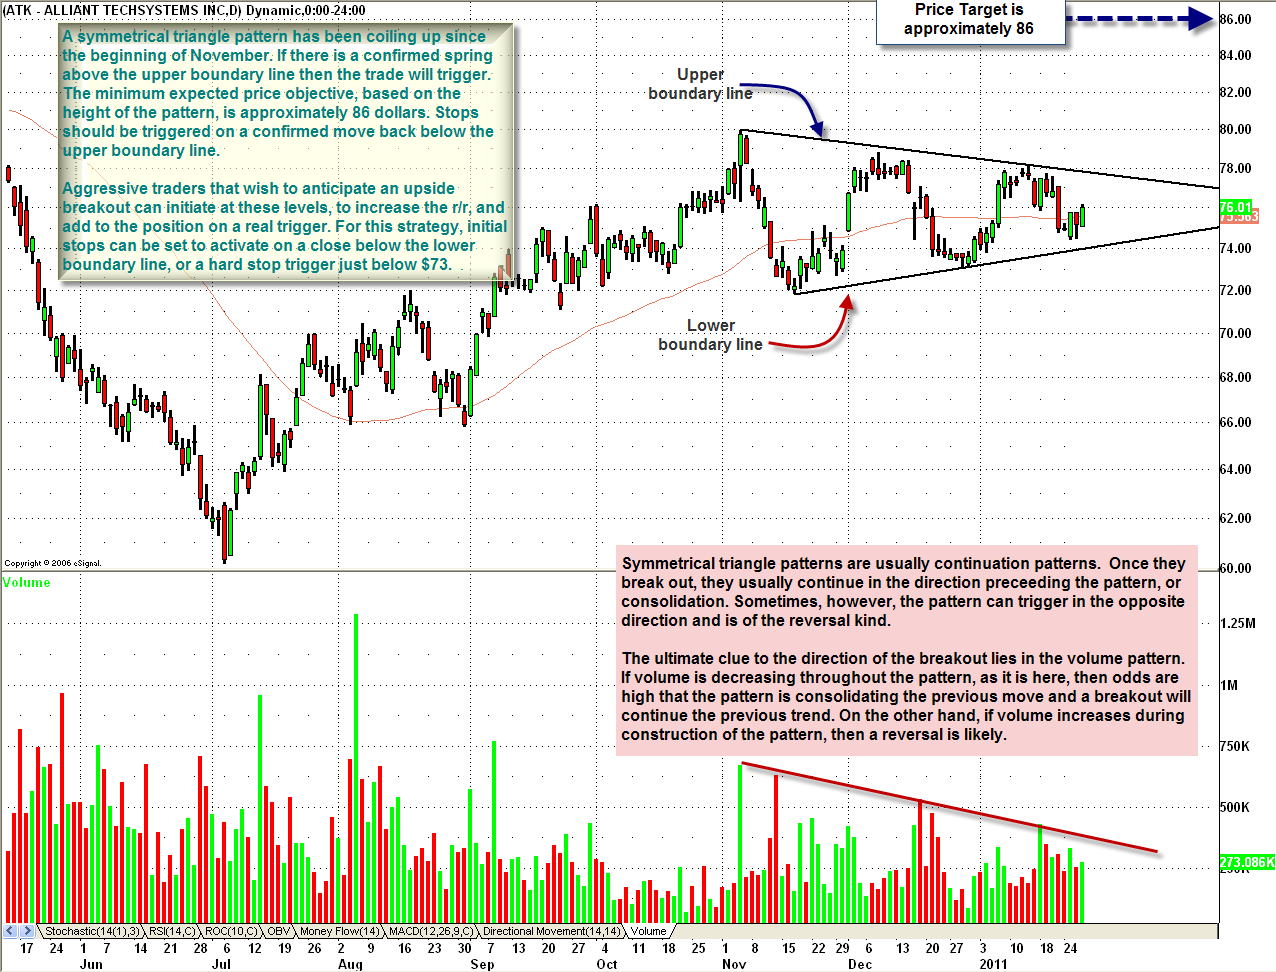
Chart 2: Outlines the symmetrical triangle pattern on a daily chart, and explains why an upside breakout is anticipated based on the volume pattern. Also included is an alternative entry strategy, for aggressive traders that wish to anticipate the trigger.
Trigger: confirmed move above the upper boundary line, Target: approximately $86, Protective Stop: conservative: confirmed move back below the upper boundary line.
Have a great weekend!
If you are interested in receiving Zev Spiro’s market letter, please email zevspiro@oripsllc.com subject “T3”
*DISCLOSURE: No position
This material is being provided to you for educational purposes only. No information presented constitutes a recommendation by T3 LIVE or its affiliates to buy, sell or hold any security, financial product or instrument discussed therein or to engage in any specific investment strategy. The content neither is, nor should be construed as, an offer, or a solicitation of an offer, to buy, sell, or hold any securities. You are fully responsible for any investment decisions you make. Such decisions should be based solely on your evaluation of your financial circumstances, investment objectives, risk tolerance and liquidity needs. Visit the T3Live Homepage, Virtual Trading Floor, and Learn More About Us.

