
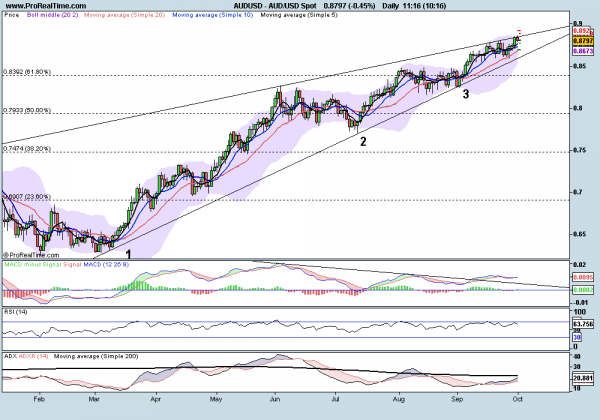
Hi. AUDUSD. I am not going to talk about the fundamental view point to any currency pairs but show the potential technical approach to what we are seeing. We are in a large descending triangle formation that has reached a thirteen month high at 0.8865. As I am sure you aware, ascending wedge’s are reversal patterns. The bottom of this formation is around the 8630-55 area. Something I like to make a note of is the amount of time we hit the trend line before it breaks. A common number for the break is 4! This is the first reason why I am looking for sell signals.
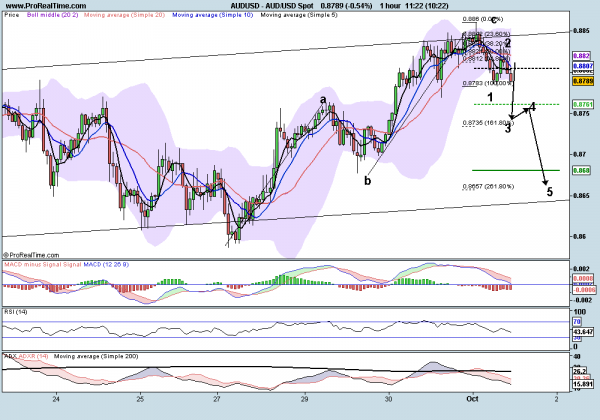
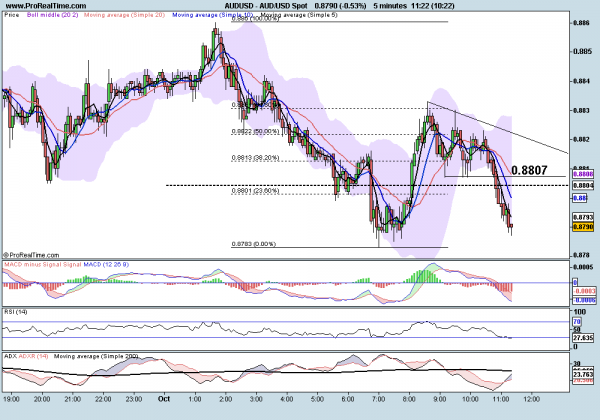
1HR: The last move up was in three waves (ABC). We then moved down in a solid manner overnight and ten retraced exactly 61.8% (wave 2). Here we see two large pincer tops (rejections) and moved lower. If we look to the 5 mins chart we can see a triangle formation (continuation pattern). The break of .8807 signaled our trade lower. Look to 0.8735 then .8655 as the next targets. Invalid count above 0.8834

