Who doesn’t like Costco? I didn’t anticipate a long list of names. The company I work for purchases a lot of our “household items” there. We buy soda, water and Kirkland nuts by the case.
IT TRENDS
COST is a stock that has been trending very nicely and anyone who owns this stock should be quite happy. Great dividends were paid out, especially back in December. On the technical side, the bullish trend is at quite a sustainable long term angle. The 100 and 200 simple long term moving averages look nice.
IT’S PAUSED
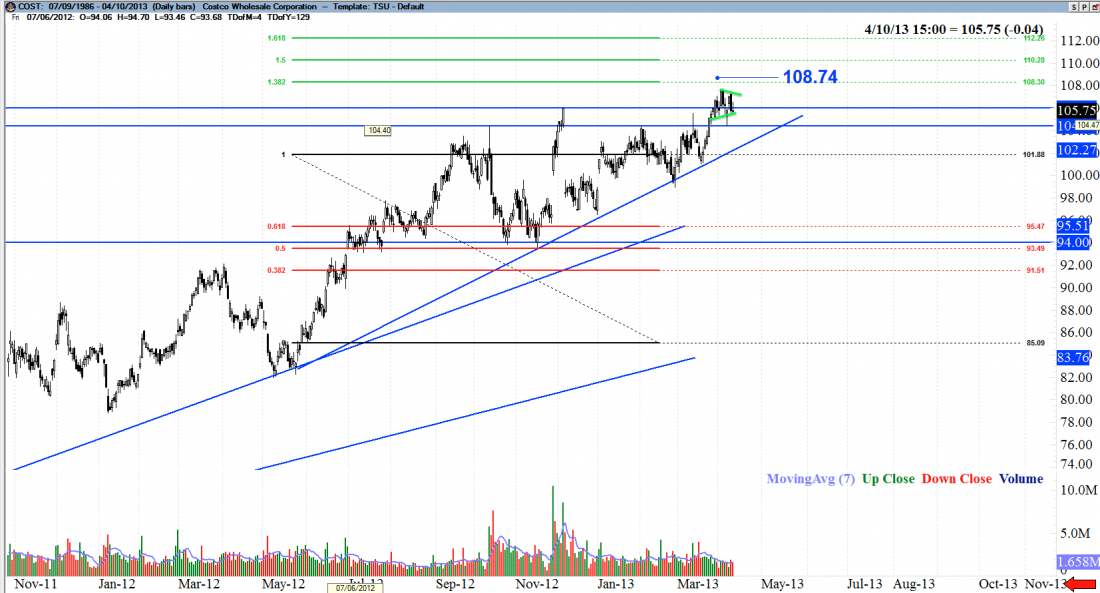
It also appears COST is forming a small consolidation pattern of sorts. This could break out in any direction.
As you can see on Figure 1 below, I overlaid a form of analysis called Fibonacci to project future targets based on a stocks waves, or its momentum.

TARGETS
There is a target around $108.00. If a close above $108.74 is triggered, the next target is $110. I took the liberty of doing a longer term Fibonacci analysis. $110 is a very strong target/resistance level on COST. There is a great chance that a pullback will happen at this location. Once it’s hit it will likely be an incredible time to sell some $115 or $110 covered calls.
OPTION PLAY
Some additional strategies include selling some naked puts on COST. Note: you should only do this strategy if you’re actually considering owning the stock. A great location to sell naked puts is under a strong support level. Selling to open May $100 puts would bring in about 52 cents per contract, which truthfully, is pretty good. You can squeeze out .08 cents for the April put expiring next Friday.
BOTTOM LINE
COST appears to be a good stock for longer term traders. Make sure you mitigate your risk!


