

By: Zev Spiro
After analyzing multiple charts this past weekend, the picture is not pretty. Major indices have traded into resistance and are ending their recent short term uptrends, accompanied by bearish candlestick patterns and negative divergences in some indicators. On Friday, SPDR S&P 500 (SPY) and PowerShares QQQ (QQQQ) broke and closed below their 20-day simple moving averages accompanied by heavy volume. Negative divergences present in many indicators include the RSI and MACD on weekly and daily time frames. The break of these moving averages signal an end to the minor uptrend, yet does not necessarily indicate a downtrend as sideways is a possibility. The Russell 2000 Index, however, is suggesting an extremely bearish outlook.
On January 26th, I commented on the potential broadening top formation in the iShares Russell 2000 Index Fund (IWM). To reiterate, IWM recently broke it’s intermediate up trend line. Moreover, an extremely rare and bearish price pattern may be forming called a broadening top formation, or megaphone. In this pattern, the price continuously makes higher highs and lower lows between two diverging trend lines. Volume during a broadening formation usually runs high and the pattern resembles a market that is out of control and lacks leadership from smart money. When this type of pattern triggers (can be seen in SPY right before the “flash crash”), the resulting down move is fast and furious.
Chart 1: IWM: Highlights a bearish candlestick pattern within the larger broadening top formation, that can be used to minimize ones risk if initiating a short position. Trigger: aggressive: initiate at these levels, preferably on a bounce, conservative: confirmed break of the lower boundary line, which will possibly coincide with a break of the 50 day sma. Stop: can be triggered on a daily close above the highs of the candlestick pattern, at $79.67.
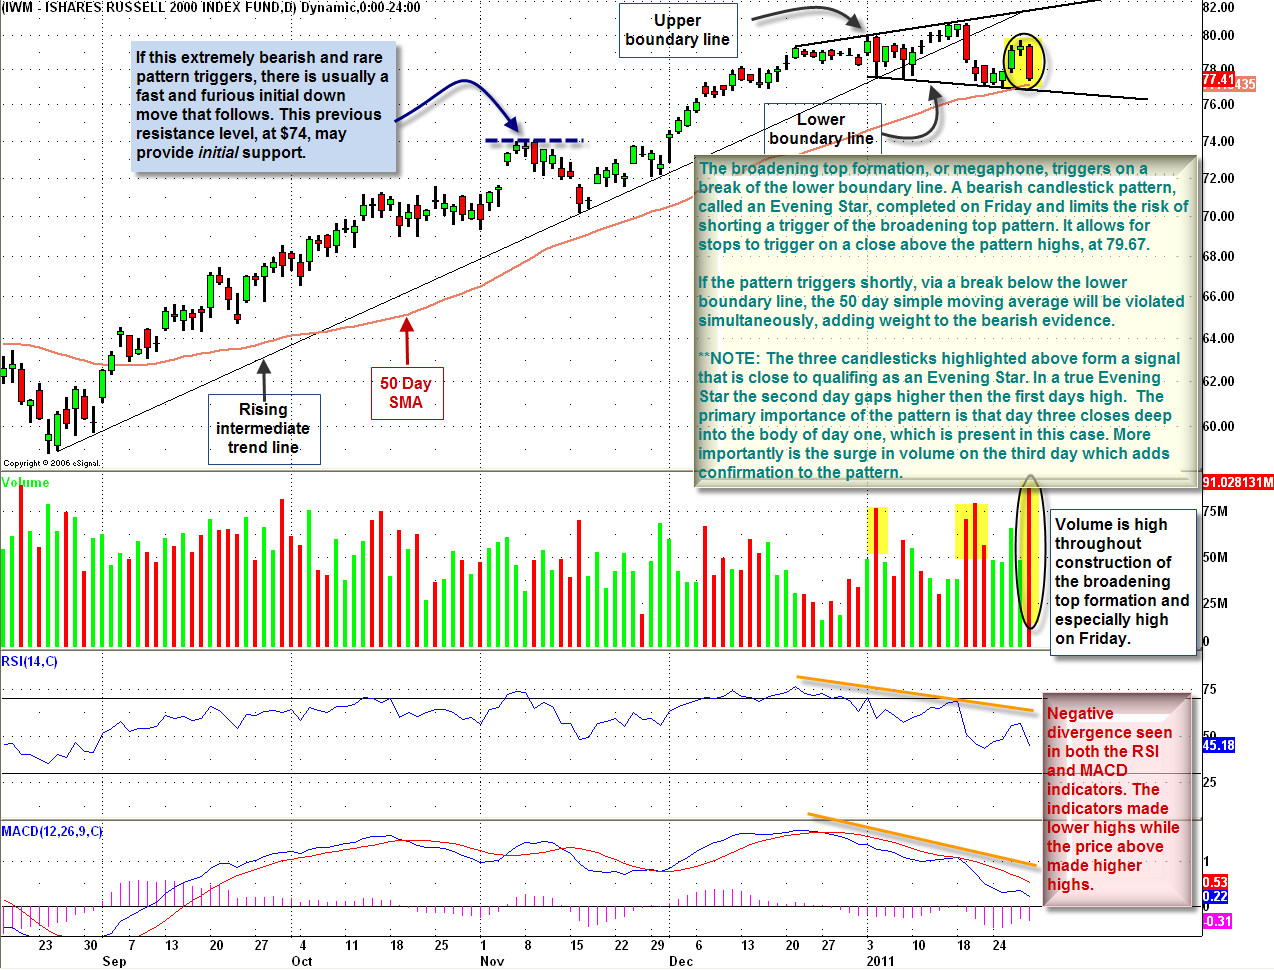
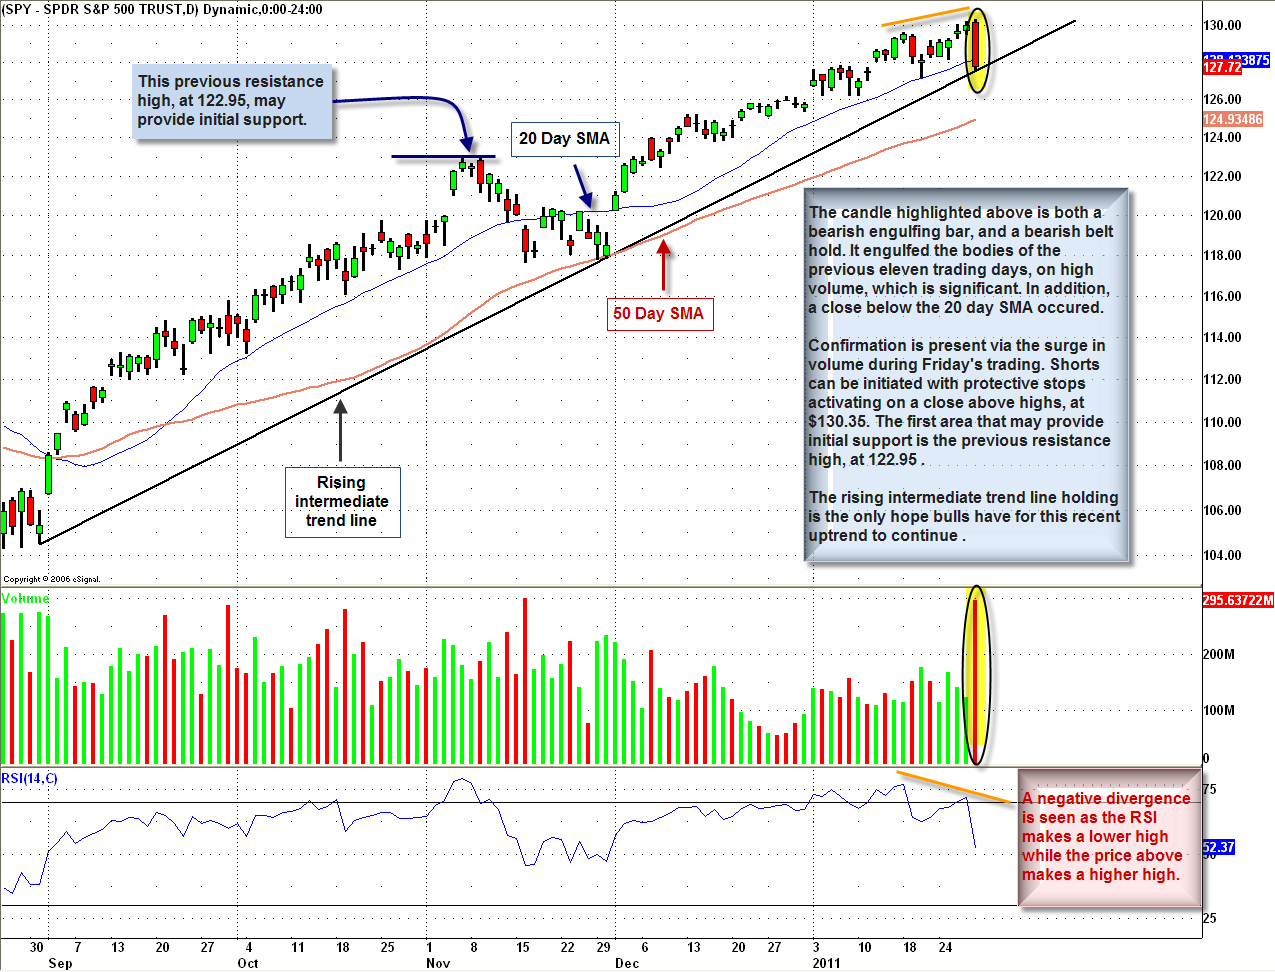
Chart 2: Highlights a bearish candlestick reversal pattern in SPY, that also occurred with a break and close below the 20 day SMA. With a bearish outlook for the markets led by the IWM, one could short SPY here with stops above the recent highs. Trigger: aggressive: initiate at these levels. conservative: initiate on a confirmed move below the rising intermediate trendline. Stop: Close above the recent highs, at $130.35.
Over the past two weeks I outlined several short trade ideas in different names. Among some of them are Dril-Quip, Inc. (DRQ), Williams Sonoma Inc. (WSM), Interoil Corp (IOC) and Deckers Outdoor Corp. (DECK). Many of these names, after triggering, have bounced and are offering another entry opportunity close to resistance.
If you are interested in receiving Zev Spiro’s market letter, please email zevspiro@oripsllc.com subject “T3”
*DISCLOSURE: No position
This material is being provided to you for educational purposes only. No information presented constitutes a recommendation by T3 LIVE or its affiliates to buy, sell or hold any security, financial product or instrument discussed therein or to engage in any specific investment strategy. The content neither is, nor should be construed as, an offer, or a solicitation of an offer, to buy, sell, or hold any securities. You are fully responsible for any investment decisions you make. Such decisions should be based solely on your evaluation of your financial circumstances, investment objectives, risk tolerance and liquidity needs. Visit the T3Live Homepage, Virtual Trading Floor, and Learn More About Us.

