Being in the right asset class is the easiest way to beat the market.
Throughout February, the S&P 500 (SPX) returned a total of five points in a volatile fashion. Meanwhile, the popular long-bond ETF by iShares: TLT returned +2.91% without the volatility. This proves that there was in fact a deflation pulse beating in the market, as bonds returned more than equities, and yields fell in a way that disagreed with risk-on.
At those elevated levels in the SPX, the risk/reward in equity risk premium versus bonds was simply not there. From an asset allocation standpoint, it paid to be safe.
PUNDITS TURNED BEARISH
It’s important to note, that behaviorally, what changed throughout the month of February, was an emergence in pundits calling for a “2-3% pullback” or even a “7-10% correction.” Volume became so putrid that the highest-level volume days were on the two violent selloffs. Essentially, volume sunk to extreme lows as the market became worried and complacent.
Typically, corrections do not tend to happen when so many are looking for a pullback.
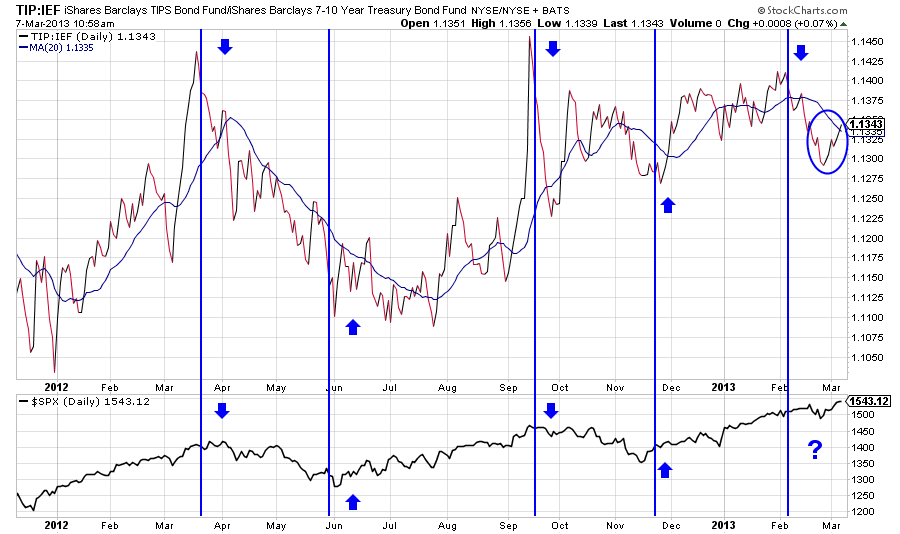
Take a look at a key intermarket trend. It is the ratio between Treasury Inflated Protected Securities (TIPS) to nominal bonds. Or in the ETF world, the iShares (TIP) divided by the iShares (IEF), which is the 7 – 10 year Treasury bond fund. A rising ratio on the chart below means that the numerator (TIP) is outperforming the denominator (IEF), which is positive for risk on.

BOND MARKET LEADS
It is often said that the bond market is the smarter of the two markets, and tends to lead especially for corrections. Notice how the chart above correlates with the SPX. As inflation expectations are realized, people buy more TIPS than nominal bonds, makes sense. However, notice how in February 2013 this trend started to reverse in a dramatic way.
This is usually a good indicator for a potential deflation pulse. It is very important to point out that you use multiple intermarket trends simultaneously and cannot rely on just one at a time. I have drawn a circle that shows a possible reversal of this trend, which would be bullish for equities. We must keep an open mind. If the ratio can overcome itself, then that would help signify risk on. However we are far from that point.
KEY QUESTIONS
Why are TIPS still underperforming nominal bonds? Why haven’t credit spreads recovered in a meaningful way? Why is the yield curve flattening and not steepening like it should in a bullish environment? Why can’t the 10-year yield break the Fed’s targeted rate of 2% inflation and also rise concurrently with stocks like it did in January? If these things were to resolve themselves, then we could see another explosion in equities, and you would not have missed the major move higher.
Otherwise, the big risk still remains to the downside. The Great Rotation? What Great Rotation? Out of Apple and gold? Main Street is not partaking in this rally. Every day people think Wall Street is in a bubble, because it is. Greed is prevailing over rationality. The income gap in America only grows wider.
What likely happens to spark a stock market correction is when the market frustrates all participants and bulls are basking in their glory? Yes, free markets are skewed. But no dynamical system can be taken out of balance for an extended period of time, without finding its balance again. If bears get killed in a climatic blow-off top, and the market takes the elevator ride down, what will fuel the rally?
MAJOR RED FLAGS
There are various intermarket trends that are not confirming this move higher in the SPX. These include: 1) The cyclical trade has not been consistently outperforming since January, 2) defensive sectors have been leading, 3) dividend stocks have been relentless, 4) the bond market has many questions I highlighted above that do not confirm the excitement in equities, 5) small-cap stocks have been lagging since mid-February, 6) cyclical commodities like silver, copper, and oil are broken and signaling possible deflation, 7) the dollar is strong, signaling a flight-to-safety trade. This is not bullish behavior within the market.
BOTTOM LINE
While I do not think we’re at an August 2011 repeat, this was the most recent correction where there was an extended disconnect between equities and intermarket trends.
Don’t fight the Fed? Markets corrected post QE3 in September. Bernanke isn’t known well for his forecasts, but he assured us there wasn’t a bubble… Believe this at your own peril.
= = =
Read John Murphy’s views on intermarket analysis and stock and bond forecast this year.


