

Sentiment Polls, Fund Flows and Short Interest Are Great Guideposts
Sentiment polls and surveys are a quick and easy way to see where money is being placed, or at least ‘talked about’. They are often good as contrarian indicators, but when they trend it is not safe to bet against the tide. Polls are quite arbitrary and fickle, notice how politicians use them to leverage their position based on what the people are saying. Markets change direction swiftly and with force, hence sentiment polls often shift on a dime.
Back on September 29 it appeared the stock market was heading down into the abyss, sentiment polls were steep in bearish territory. That sentiment was seen in the AAII poll, the Institutional Investor poll, weather vane and various blogger polls. These investor polls were flashing red flags for weeks, but at this point the sentiment was washed out and when a market turn happened (literally days later) we saw bulls start to get aggressive again.
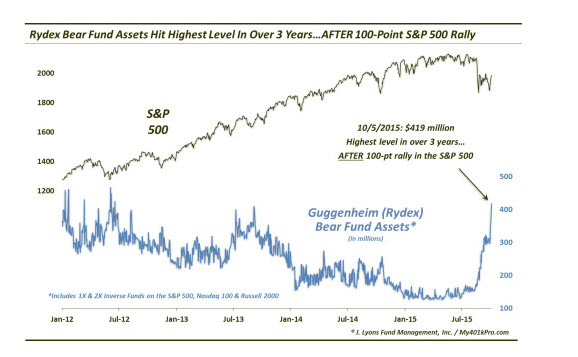
The rydex ratio is a great long term tool that measures the flow of money into bullish vs bearish funds. This is a raw number that can lag and stay extreme in trending markets. When more money is flowing into bullish funds the ratio drops, and vice versa when money flows into bearish funds. From 2012 until around summer this year this ratio was extremely bullish, but this normally serves as a contrarian indicator. Yet, the ratio started to rise sharply in early October this year when the market bottomed (at that time, we didn’t know it was a bottom).
It appears when the crowd is getting the most bearish as it did (see the chart attached by Dana Lyons) then this was the time to go bullish. Okay, hindsight is 20/20 – but we can follow this indicator for when it occurs again and take advantage of it.
Finally, short interest figures play an important role in determining sentiment. Along with the rydex ratio, when the crowd is shorting stocks heavily it is a time to take notice that a change is likely to happen soon. Now, there are many reasons to short stocks – among them hedging activity and convertible arbitrage. Yet, when the short interest starts hitting historically high numbers this works as a great contrarian indicator. The moment of height is where the markets generally turn, and this happened again on October 2 when short interest peaked.
Price and volume are the key drivers to analyzing the charts, but we find polls, flow and short interest to be valuable pieces of information. Analyze them carefully and often, they may keep you on the right side of a trend.

