
The week of March 2 the SPY broke below the 11/21 on very light volume.Breaking a previous low on lighter volume implies a false break to the downside and some point the market should reverse and close above the previous low.Last week the SPY closed above the 11/21 low and a bullish sign.Normally when a low is broken by a fair amount the market will attempt a re-test of that low but won’t make it back to the previous low.Normally support on the re-test attempt will come in near the previous low which in this case it’s the 11/21 at 74.34.Volume on the re-test attempt should be lighter compared to the current leg up and if this is the case then a bullish signal will be triggered.After this potential pull back, the next leg up should show a Sign of Strength” to help confirm the up-leg.The next leg up should find resistance near January 6 high near 94.45 on the SPY.Therefore we will look for a buy signal near the 74 range on SPY which equates to 740 range on SPX.
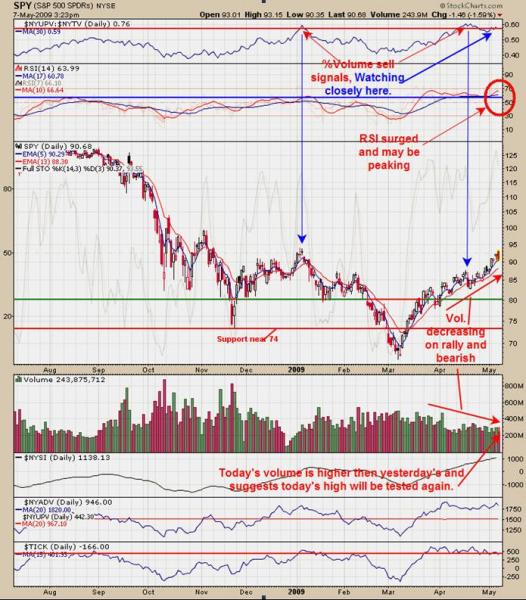
Short term the SPY may attempt to test the 2/26 high near 80 and find resistance.We would like to see the 2/26 high tested on higher volume and that would be another bullish sign and would give us confidence on buying the next pull back.The pattern that may be forming near term is a Head and Shoulders bottom where the 3/6 low is the Head and the Left Shoulder formed in late February, (see chart above). Therefore the market may find resistance near 80 (Neckline) and form the bottom of the Right Shoulder near 74.I might add this potential Head and Shoulders bottom has an upside target near 1/6 high at 94.Since the current rally is not showing increase in volume it should run out near 80 and then we will look for a pull back to the 74 range.We will look for a buy signal near 74 range.
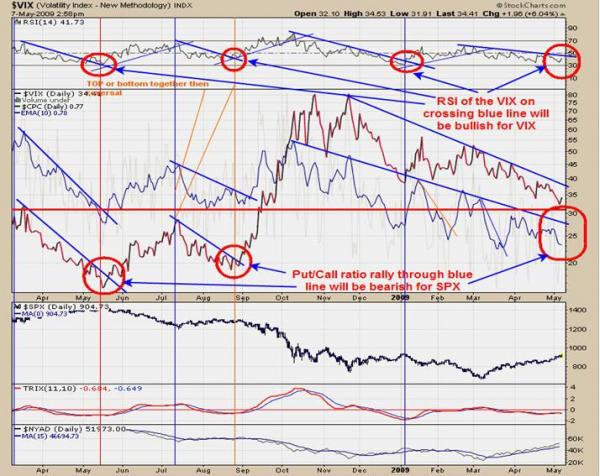
On March 10 and 12 the tick index closed at +1462 and +1102 respectively.After these extreme uptick readings the market still moved higher and is a change of character when previously these high of uptick closing produced pull backs in the market.This change of character is a bullish sign. The “Max Pain” for SPY comes in at 78.If Spy closes at 78 on Friday’s option expiration then that will produce the maximum loss both for the open put and call traders for the SPY.
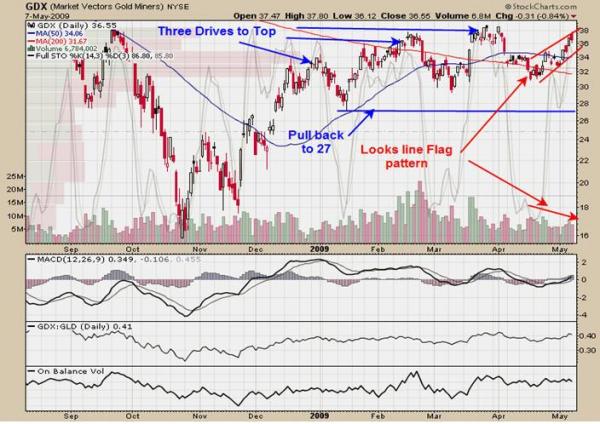
Above chart is courtesy of www.etfinvestementoutlook.com.In mid February the McClellan Summation index for GDX rolled over and showed that the upside momentum has turned down for the short term.We have labeled on the chart above what is an Elliott wave up five count up.Elliott Wave five counts go in the direction of the impulse wave (this case up) and market correct (consolidate) in a three count down.Current it appears that GDX is in a consolidation phase and with the Summation index moving down it helps to confirm that idea. Normally support comes in near the previous four wave and the low on the four wave low came in at 27.GDX may pull back to that support.Previous we where looking at a possible Head and Shoulder bottom pattern and that still my be in play but it depends on the current pull back.If market stays there current levels which is where the Neckline is then the H&D will be in play.If GDX pulls back to 27 then that will negate the H&D the Neckline break should not go below the Left Shoulder low.Right now it does not make a howl lot of difference in that the current consolidation is not complete. Once this consolidation is complete another Elliott wave five count up should start which will be wave 3 of one degree larger Elliott wave count.Wave three larger degree will be at least 20 GDX points up as that was the length of wave 1 of larger degree (wave three is never short then wave one).The current consolidation could last several more weeks.Our upside target on the next rally phase is still near the 55 range on GDX.
Sold PMU on 2/29/08 at 1.20, bought at .81 for gain of 48%.

