

Have you ever heard of the Bradley Model?
Most likely you have not.
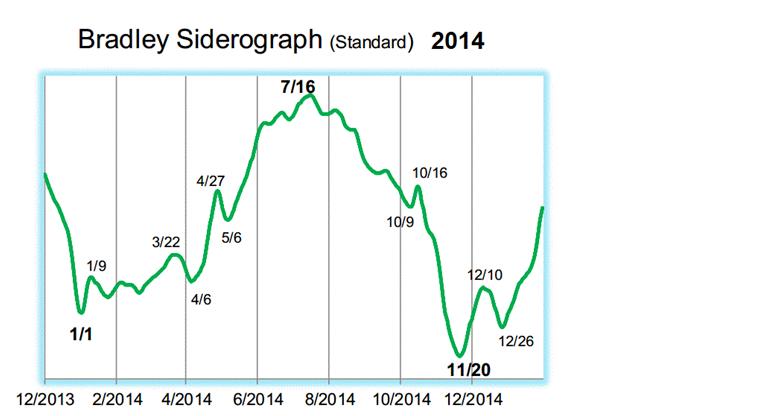
The Bradley Model Siderograph was developed in the 1940s by Donald Bradley to forecast the stock markets. Bradley assigned numerical values to certain Planetary constellations for every day and the sum is the siderograph (see Figure 1). The Bradley Siderograph is meant to forecast major and minor turning dates in the Dow Jones & S&P 500 indexes. It does not forecast or predict whether that turn will be higher or lower. It does predict the strength of a trend by the degree of the incline or decline on the Siderograph.
This Year’s Action
The 2014 Bradley Siderograph has been fairly accurate so far this year. It shows in the first four to five months of 2014, the U.S. indexes would be mostly sideways (no trend).
Then in May, it shows a stronger trend starting that will run into mid July. This is close to what has occurred this year. Next, the 2014 Bradley Siderograph (see Figure 1) shows a major trend change date (bold dates) on July 16 (+/- 7days), that will last thru mid November (11/20).
The new trend looks like a really strong one by the degree of the decline on the Siderograph. With the S&P 500 at all-time new highs and at the yearly R1 pivots (see my article from last week “S&P near yearly pivot point resistance”), will we get a 10%+ correction that is long overdue?
Or will the stock market explode higher this summer and fall? We will know in a few weeks.
Related Reading
Read another story by this author.
Pivot Points Are A Predictive Indicator
= = =

