

If your vendor supports using Microsoft’s RTD syntax and provides the ability to call market data by a date from the platform into Excel, then you can build a valuable market-performance table.
Traditional charting for reviewing past market-action can be somewhat tedious when looking to see how a particular stock or futures contract has performed during previous periods. For example, maybe you would like to see how Apple (AAPL) has performed during the month of December for the past ten years. Or perhaps you’re interested in how March corn has behaved during the fourth quarter for the past ten years.
To look at charts, you would have to scroll through ten years of data for Apple, writing down the closing price for December 1 and 31. For the futures contract, you would have to open a chart and manually change the symbol year for each contract and log the starting and closing prices for each period for each year. However, if you can pull closing prices for a market by a date from your data source into Excel, then you can easily build a table that will gather the information for you and present it in a single display.
For example, here is the RTD syntax for calling the close of AAPL by a date (12/01/2011) from CQG (your trading platform may be different).
=RTD(“cqg.rtd”,,”StudyData”,”Close(S.AAPL) When (LocalYear(S.AAPL)=2011 and LocalMonth(S.AAPL)=12 and LocalDay(S.AAPL)=1)”,”Bar”,””,”Close”,”D”)
And here it is for the last day of the trading year in 2011.
=RTD(“cqg.rtd”,,”StudyData”,”Close(S.AAPL) When (LocalYear(S.AAPL)=2011 and LocalMonth(S.AAPL)=12 and LocalDay(S.AAPL)=30)”,”Bar”,””,”Close”,”D”)
You now have the two different closes so you can calculate the difference to determine Apple’s performance for the month. All you have to do is change the symbol, year, month, or day within the RTD call to get the closing differences for the various symbols.
Simplify the Process
To make this an easier process, we benefit from RTD’s flexibility in allowing you to reference another cell for parameters. For example, you can enter in a date into one cell and have the RTD in a different cell call the date from that first cell. This creates a very seamless process for gathering market information.
To use cell referencing, we can use the concatenate function in Excel. Here is a trick.
- Use the ampersand symbol (&), which is a form of the concatenate function, to reference other cells for the symbols and dates.
The Steps
Notice in the RTD syntax above, there are open and closing quotes for each parameter, such as “Close” at the end of the syntax. This could be Open, High, or Low.
In the RTD syntax example above, following the parameter “StudyData” we are calling for the Close of S.AAPL when, etc.
There is a quote to start the string for the parameter for the close of the symbol and the date and then a quote to close the string right after the LocalDay = 1.
Now, to replace a cell reference for the symbol, we have to use a quote and the ampersand to start the merge in the cell location and then another ampersand and quote to complete the merge. For example, the symbol S.AAPL is in cell B3, and the RTD syntax will look like:
“Close(“&B3&”) When
And if we have the year in cell D3, the month in cell E3, and the day in cell E 3, our RTD call from above will look like:
=RTD(“cqg.rtd”,,”StudyData”,”Close(“&B3&”) When (LocalYear(“&B3&”)=”&C3&” and LocalMonth(“&B3&”)=”&D3&” and LocalDay(“&B3&”)=”&E3&”)”,”Bar”,””,”Close”,”D”)
If we use the dollar sign to fix the location of the symbol cell (the RTD call will always use the symbol in cell B3), the new RTD call looks like:
=RTD(“cqg.rtd”,,”StudyData”,”Close(“&$B$3&”) When (LocalYear(“&$B$3&”)=”&$C$3&” and LocalMonth(“&$B$3&”)=”&D3&” and LocalDay(“&$B$3&”)=”&E3&”)”,”Bar”,””,”Close”,”D”)
If we use cells C3,D3, and E3 for the start date year, month, and day parameters and cell F3, G3, and H3 for the end date parameters, and in cell K3 the difference between cell J3 and I3 is calculated, we can copy the formulas down and the output will look like this in Excel.
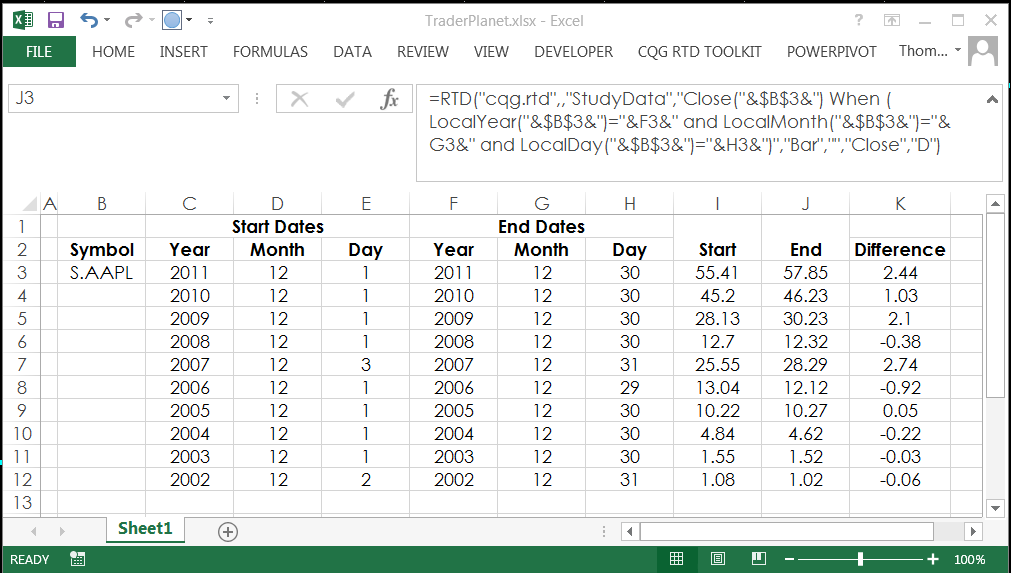
Just change the symbol in cell B3 and the dates in the various columns, and Excel will pull in the data and calculate the closing price differences in column K.
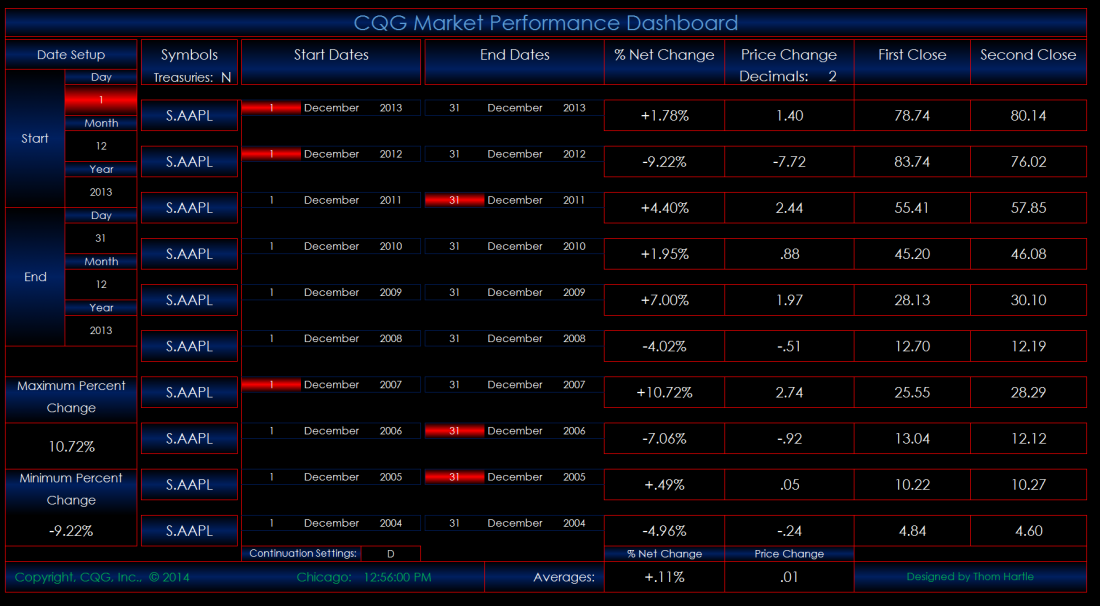
If you want to spend a little extra time, you can dress up the dashboard and calculate other information such as percentage change and maximum and minimum changes.
Conclusion
Excel is a phenomenal tool for traders. Learn how to bring the data in from your platform and utilize the features of Excel to design dashboards for your particular needs.
#####
To read more from this writer …
Related Reading

