

Who says corn is going higher? This guy.
Click here to watch a video explaining how to read markets using volume at price.
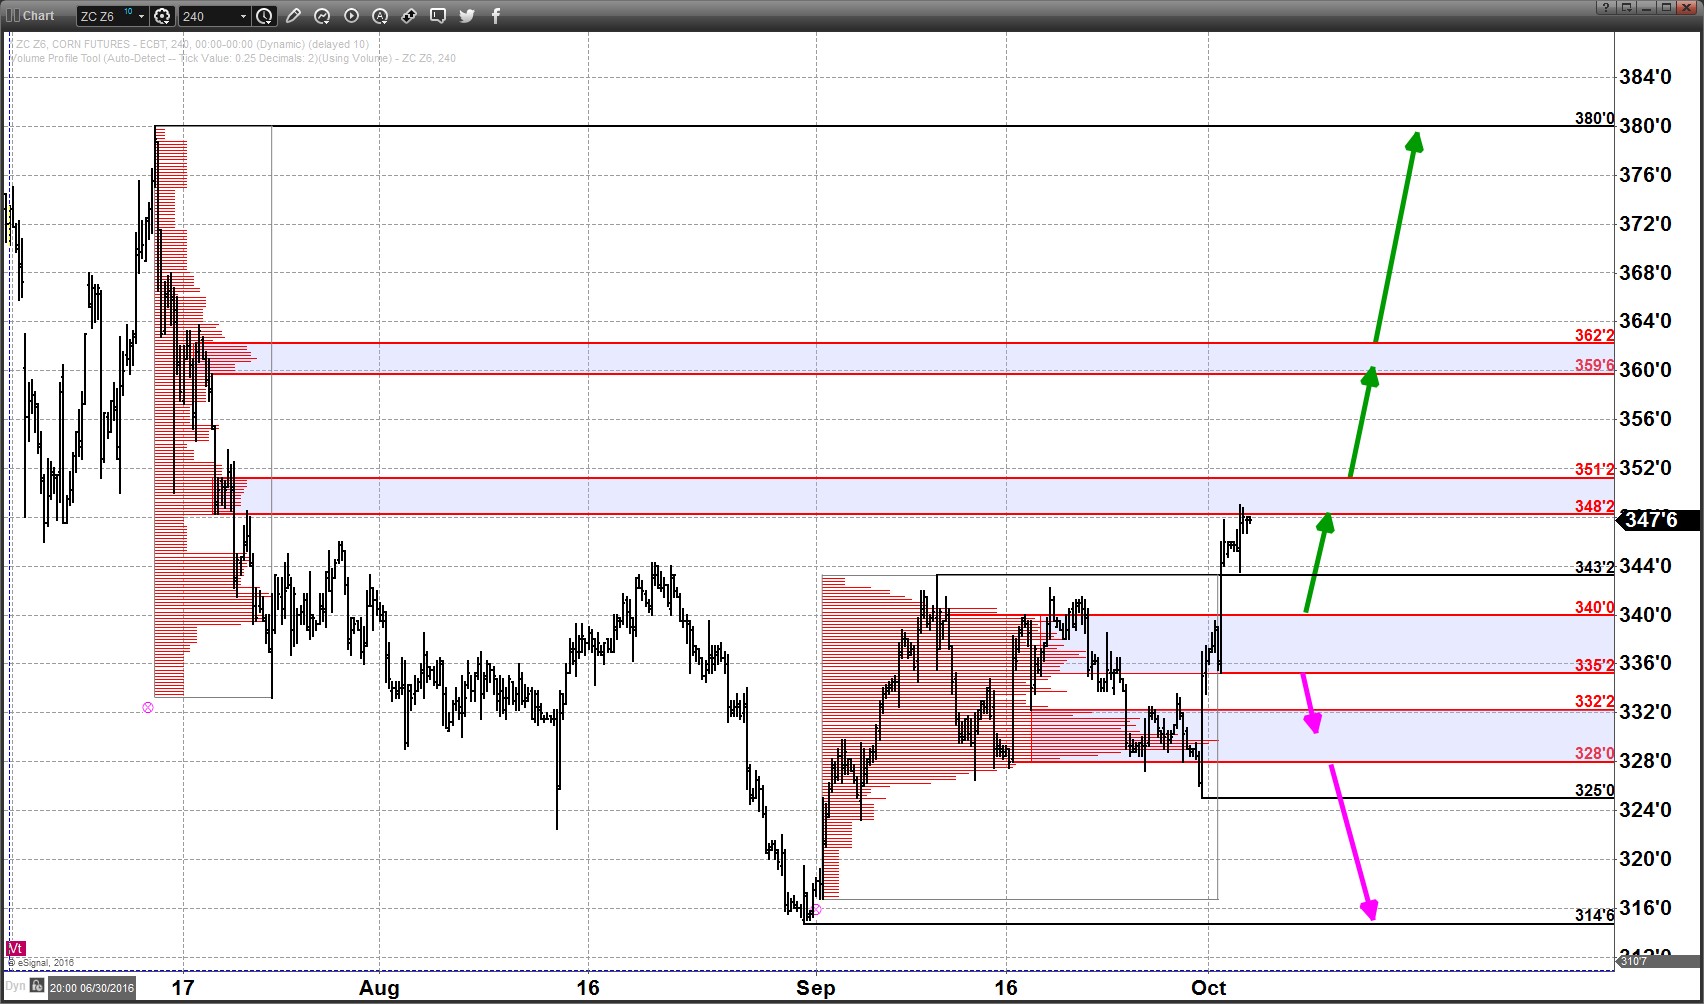
Corn has finally shown some signs of life by breaking above the 340 and 343’2 levels. These are now established as nearby levels of support and the bias in December corn is pointing decidedly upward while above these levels.
This initial move higher has already hit the first zone of resistance at 348’2 – 351’2. Price behavior at this first zone should be telling. If prices can break above this zone quickly and without much pullback, which I feel currently the odds favor, this will further demonstrate strength and be a bullish signal. If prices can exceed 351’2, the next resistance / target is at 359’6 – 362’2, and from there… 380.
On any selling pressure at this 348’2 – 351’2 resistance zone, so long as 343’2 and especially 340 remain intact, the larger bias will remain bullish.

