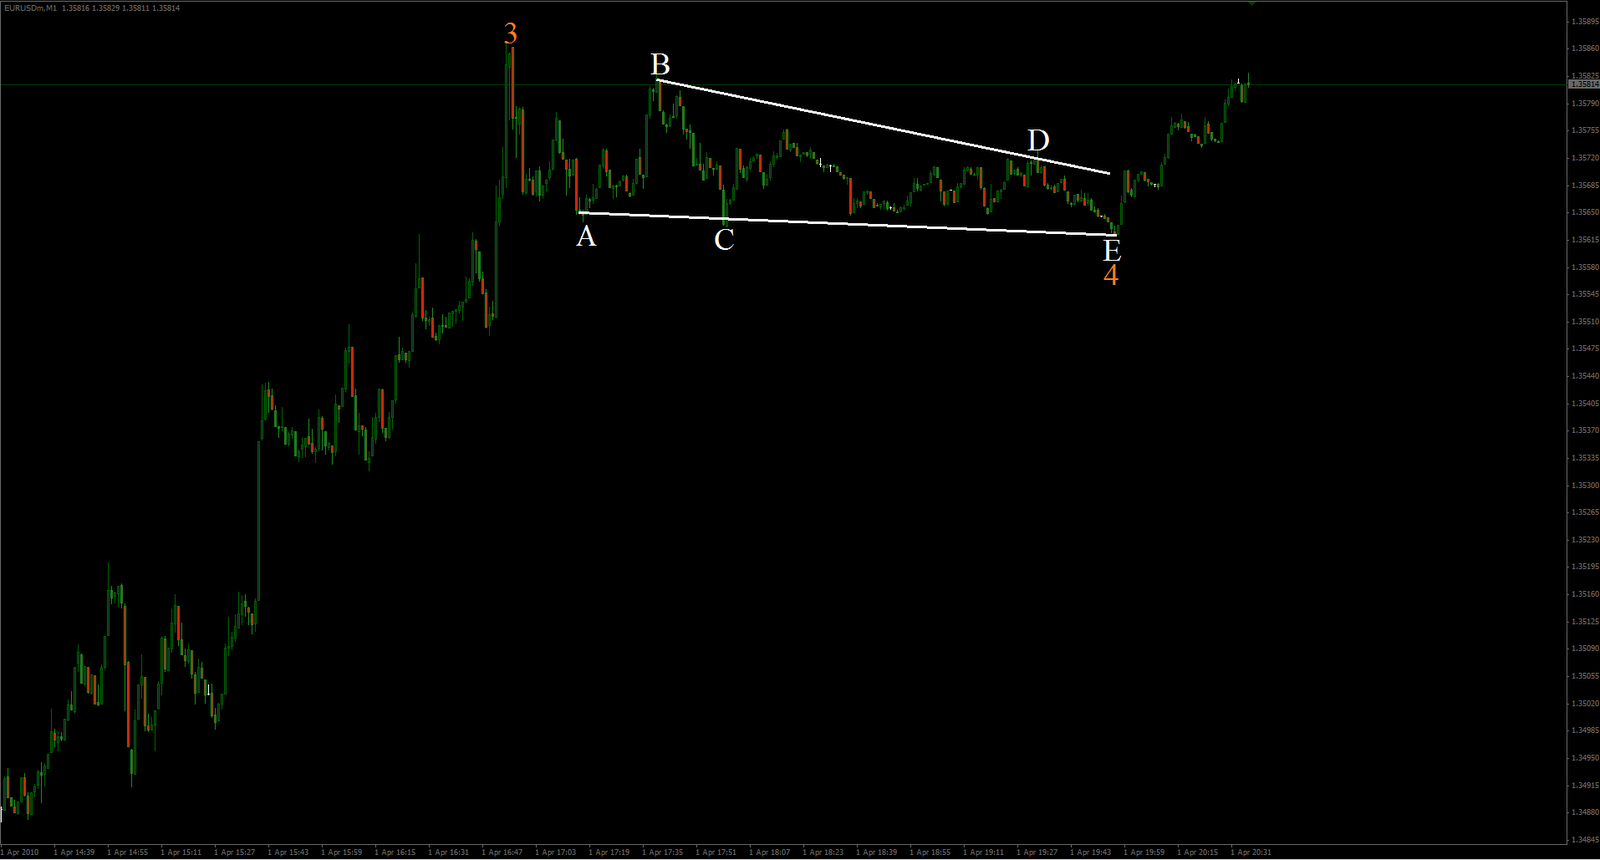
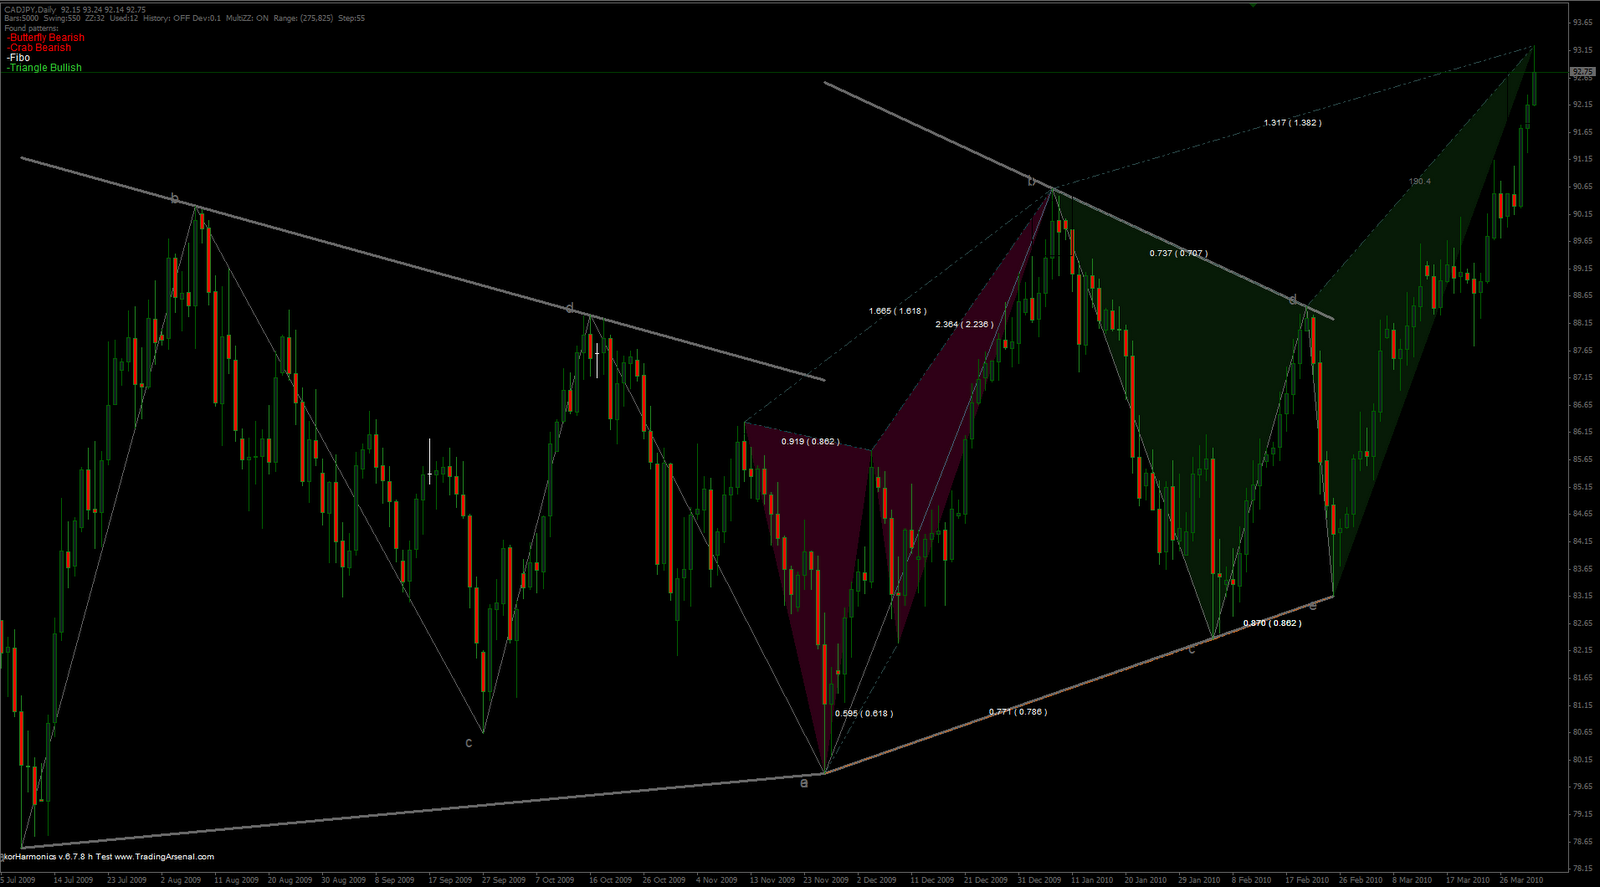
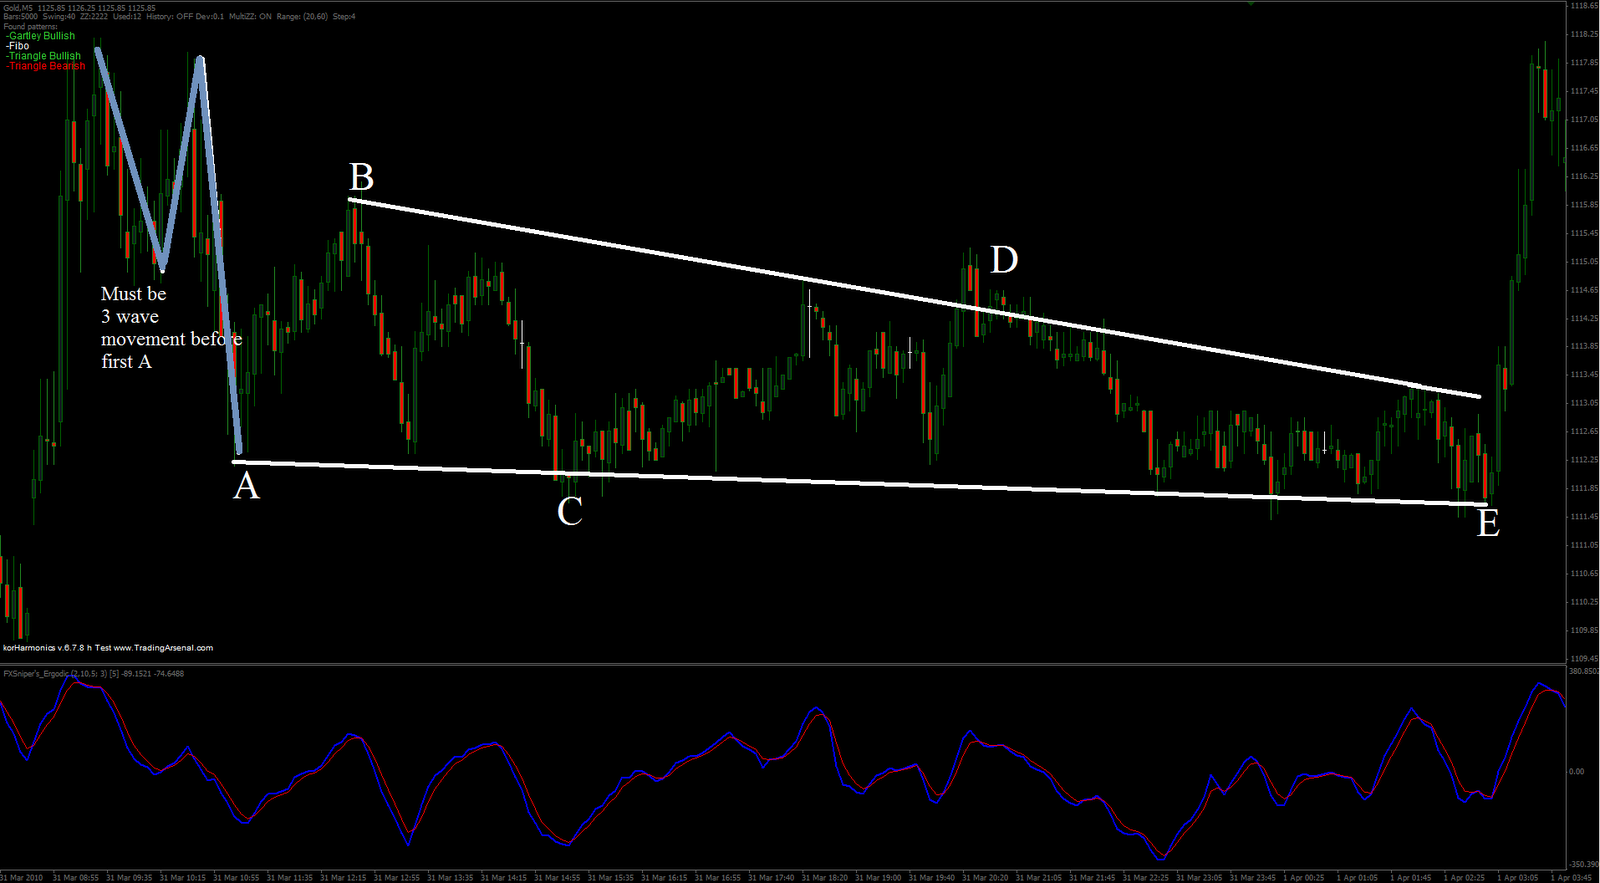
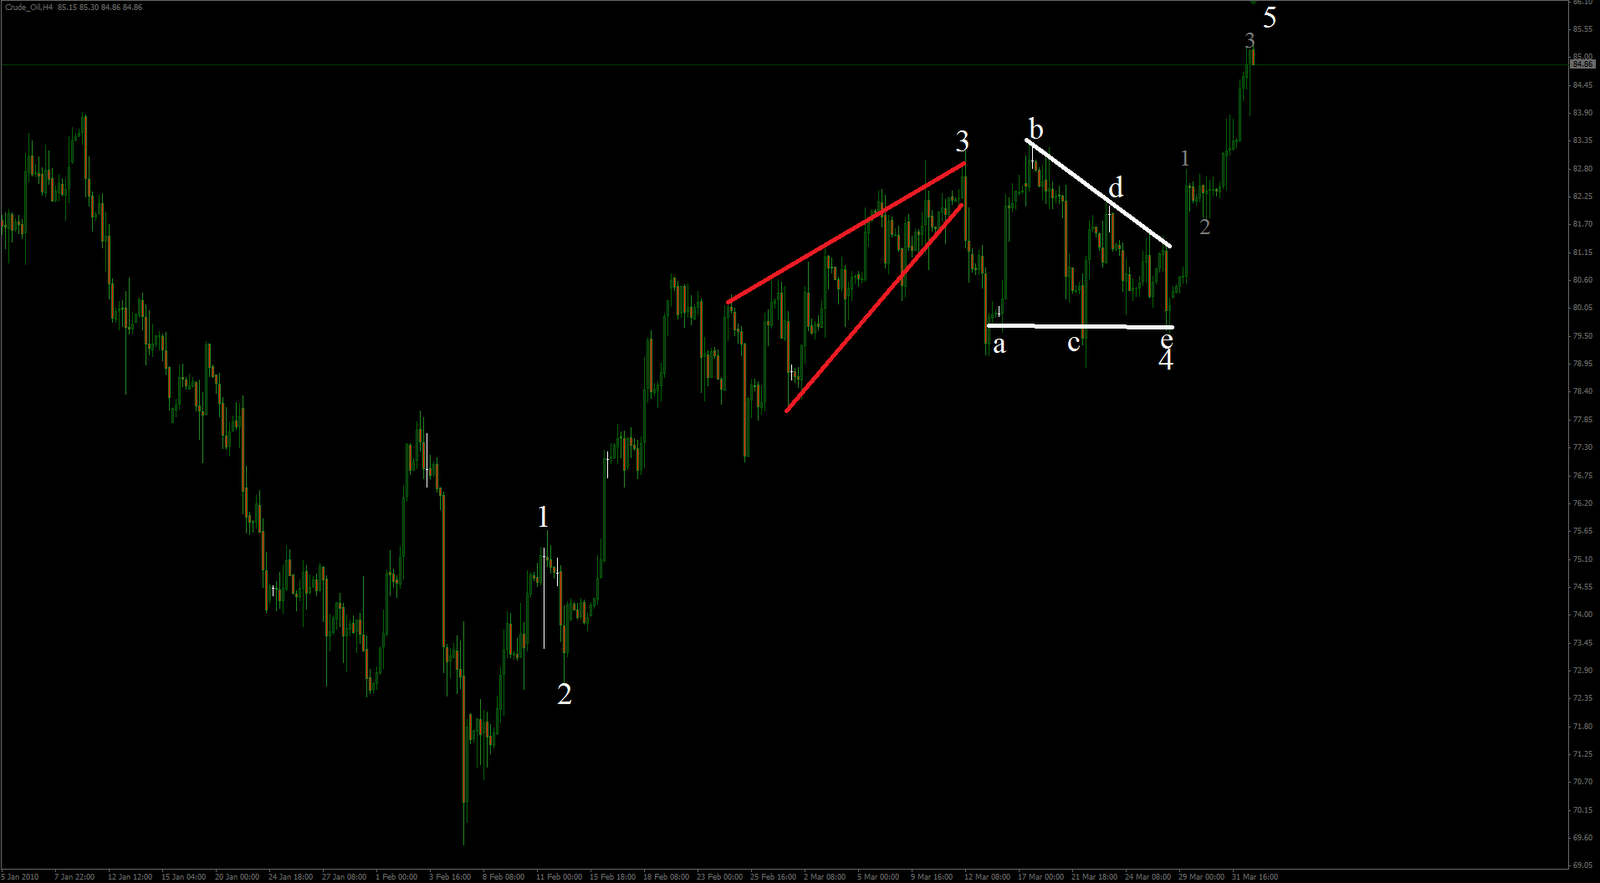
Triangles everywhere nowdays it seems. For entire Oil EW picture I have no clue what it is, tried to breake for while, but it´s too difficult, but this one last impulse looks reasonable clear. Gbp-Usd was today also triangle before “blow-out”. Most interesting is however daily chart of CadYen, again just one more yen rally chart but didn´t noticed this before with such an huge chart – you do not often see daily chart contracting triangles, more interesting is that it was there twice. This butterfly raises some question marks whetever or not something is about to finish on there also in near future or not, might try to take deeper look for before next week. EurUsd triangle was only in 1 minute chart before closing US stockmarket but looks that some smaller degrees ended with this one or is about end.