Since early May of this year gold is locked in a 100 point trading range from 1150 to 1250. A situation that I feel is about to change one way of the other and breaks should get carry over.
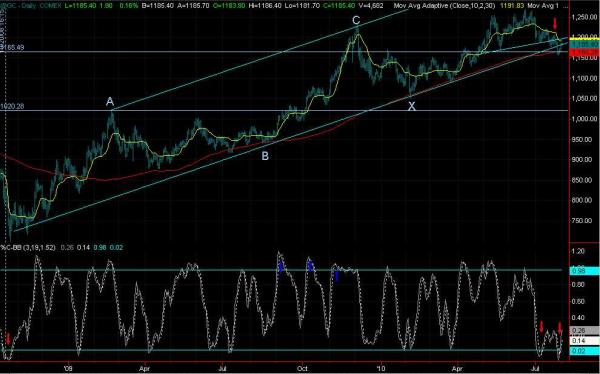
On the bearish side the two most recent sell offs have created what I call momentum surges. Radical oversold readings (highlighted by the two red arrows on the indicator) normally call for more price decline in the near future. Prices have also finished a head and shoulder top with a classical pull back to its neckline – highlighted by the red arrow on the daily bar chart. Gold’s short term adaptive moving average has turned lower and prices have fallen out of their ascending channel that began in October of 2008. All of this is very bearish indeed and also very obvious to the majority.
These factors are so obvious that a bear trap can be put in place with a move above the last and most recent high price of 1197. Over the past 10 years the majority of time (8 out of 10) the market has witnessed bull market advances in August. The 144 day moving average is ascending and has held back all sell offs since the October lows of 2008. All of this less obvious stuff supports a move higher lead by the trapped short sellers covering and the next phase of good buying to new highs, i.e. a break above 1250.
In either event, I expect the choppy action of the last 3 months to end, the daily range to expand and volatility to increase. Don’t fade the breaks, trend them.