
 We have a new section at Phil’s Stock World, it’s called Chart School.
We will be featuring Technical Charters and Analysis from some of the top people on the web. If you are interested in contributing or know someone you think would be a good contributor, contact Ilene@ our .com address (I don’t want her getting spam by putting her email in a post!) and let her know who you think would make a good addition to our roster. We’re looking not just for nice charts, but also for people who are skilled in explaining them. A good chart person needs to be a little bit of an artist, which is why I’m not one – my drawing skills make my daughters laugh, and not in a good way!
Like all good art, charts are subject to interpretation and different people will see different things, and come to different conclusions -from looking at exactly the same thing. That’s why I like to look at lots of different charts and try to check my bias at the door and let art speak for itself. Here’s a few that caught my eye this morning, starting with this interesting S&P chart by Ichimoku, who uses the SPX Price/TRIX daily divergence to catch a possible correction brewing just ahead of us (something I agree with for fundamental and technical reasons):
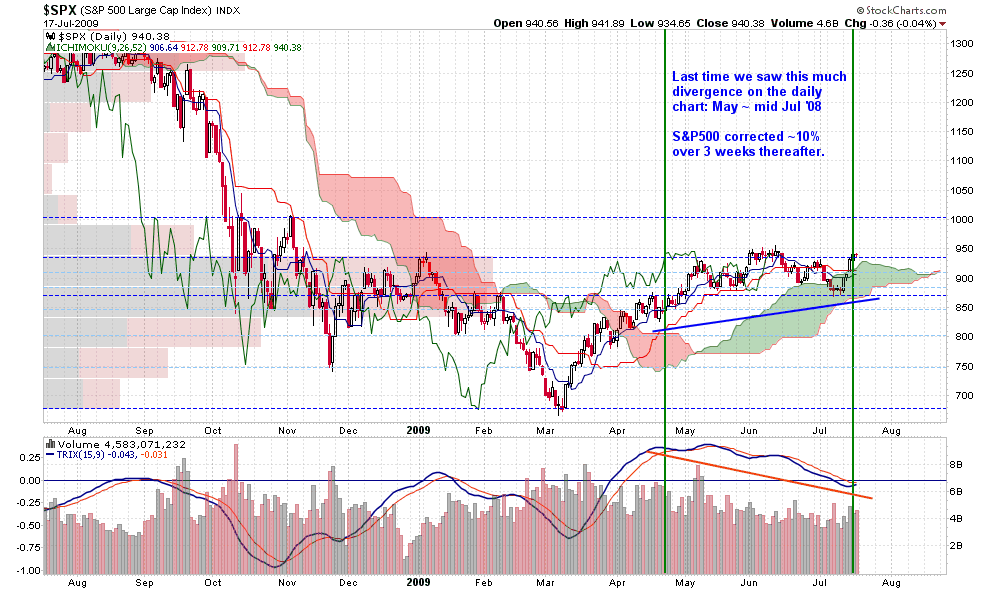
Interetsing stuff! Of course, I will caution members (as I had to when everyone was getting “Head and Shoulders” fever) that these are unprecedented market moves and “normal” charting techniques will often fail you here. We have record amounts of cash on the sidelines in proportion to the size of the market, which itself is trading on low volumes, which means it doesn’t take very much to override a bearish chart. It also would not take much of a panic to wash out the relatively small number of people who buy into the market every day.
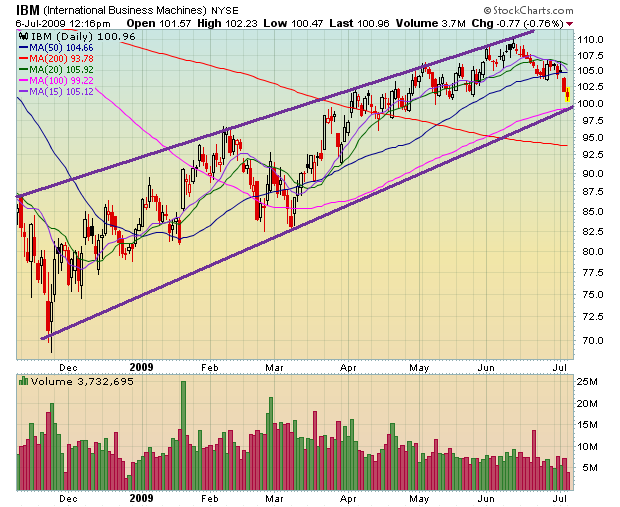 As I mentioned in yesterday’s comments, just 20M out of 1.3Bn of IBM’s shares were exchanged yesterday at prices that averaged $112.50 per share yet that $2.25Bn worth of rangey trading upped IBM’s total market cap by $6.5Bn. Should the other 98.5% of the shareholders decide they’d like to get the$115 closing pricefor their shares, they may find the “value” isn’t quite what the chart says at the moment. This is nothing against IBM, they are worth about $115 – as long as…

