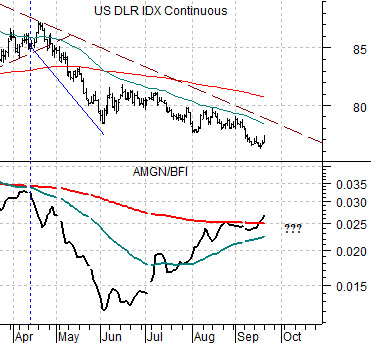
We have focused so many times over the past few months on the way the U.S. dollar trends ‘with’ the share price of Amgen (AMGN) and inversely to ocean bulk shipping rates (Baltic Dry Index- BFI) that we won’t bother to go back through the details today. Suffice it to way that the ratio between AMGN and the BFI is a reasonable surrogate for the dollar’s basic trend.
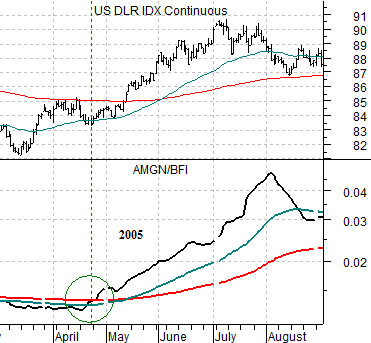
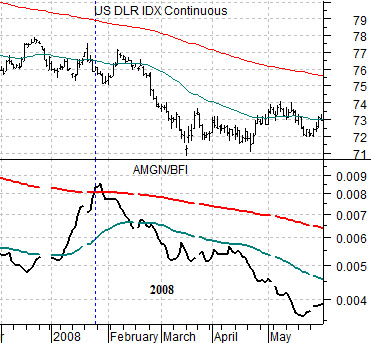
Below is a comparison between the AMGN/BFI ratio and the U.S. Dollar Index (DXY) futures from 2005. The argument is that when the ratio breaks above the 200-day moving average (red) line the dollar tends to turn upwards. The twist is that the ratio has to continue to rise once it moves through the moving average line. In early 2008, for example, the ratio nipped above the line before breaking back to the down side. In 2005 the dollar rose close to 10% after the ‘cross’ while in 2008 it fell close to 10% after the ‘cross’ failed.
Below we show how the ratio turned lower in April of this year as the dollar notched down almost 10% (from around 87 to under 79) and how the ratio is pushing back above the moving average line at present suggesting the potential for a reasonably quick 10% bump to the upside.
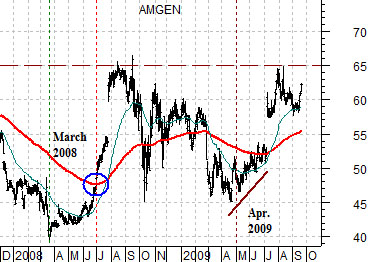
As long as we are fixating on the trend for Amgen (AMGN) we might as well run through its broad relationship to the equity markets.
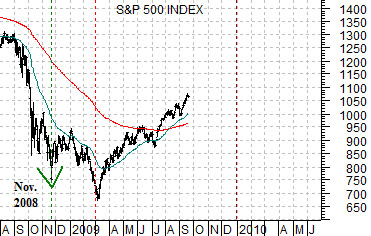
Below is a chart of AMGN along with a chart of the S&P 500 Index (SPX). The charts have been shifted or offset by exactly 8 months.
The ongoing and oft-repeated argument has been that AMGN tends to lead the SPX by very close to 8 months at major bottoms. In other words as long as AMGN is trending lower there is little chance of a prolonged recovery for the stock market.
Once AMGN swings higher, however, then the time to look for a bottom for the SPX is… 8 months later.
The absolute low for AMGN was reached in March of 2008 which forecast a bottom for the equity markets in or very close to November. This was definitely ‘a’ bottom although history will show that it was ultimately not ‘the’ bottom.
The share price of AMGN pushed above its 200-day moving average line at the start of July in 2008 so to the extent that many believe that a stock above this moving average line is ‘positive’ we can make something of a case for a much stronger equity market eight months later in March of 2009. Fair enough.
The problem this year has been that after AMGN pushed upwards into the autumn of 2008 it pulled back towards the lows into April of 2009. If we interpreted the relationship based solely on the cycle bottom for AMGN then the stock market’s bottom between November of 2008 and March of 2009 fits nicely. If we pay attention to the details then we can also make something of a case for downward pressure for the SPX through into the end of the year followed by a something of a replay of this year’s stock price recovery.
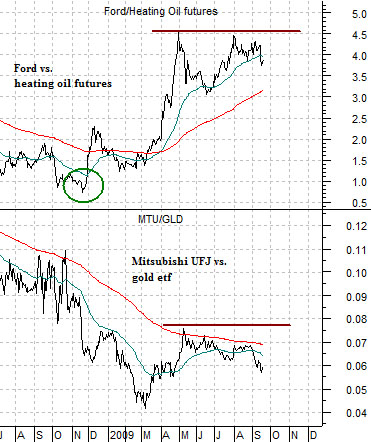
At bottom is a comparison between the ratio of Ford (F) to heating oil futures and the ratio of Japan’s Mitsubishi UFJ (MTU) to the gold etf (GLD).
The argument is that both ratios are made up of opposing themes. Ford does better when energy prices are not ‘too strong’ while the banks have been trending inversely to gold prices. If Ford is stronger than heating oil prices the trend is positive and if MTU is rising relative to gold prices then the trend would also be positive. Risk begins to rise when both ratios start to decline.
The point, however, is that we argued last year that once the Ford/heating oil ratio bottomed it marked the start of a rising and positive trend for the S&P 500 Index. The ratio bottomed out in November- exactly eight months after the correction lows for Amgen. In other words… we will have to keep a close eye on Amgen in the days ahead because its trend is important for the U.S. dollar (page 1) while also serving as something of a leading indictor for the broad U.S. stock market.
Our thought, by the way, is that downward pressure on the equity markets through the fourth quarter will occur as a result of dollar strength and offsetting commodity price weakness. The energy and metals sectors tend to push upwards through the first half of the year so our expectation is that towards the end of the year we will start to look for promising commodity-based or Asian-growth themes.