by Kevin Klombies, Senior Analyst TraderPlanet.com
Friday, September 12, 2008
As previously mentioned we will be gone from Sunday through Thursday next week. We should be able to prepare an issue for Monday before we leave if all goes well. This means, by the way, that we will miss Tuesday’s Federal Open Market Committee meeting. As of today the markets are placing 90% odds of no change in the 2% funds rate and 10% odds of a 25 basis point rate cut.
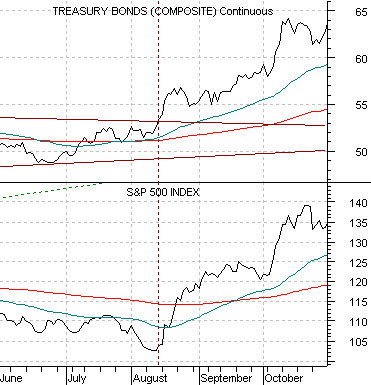
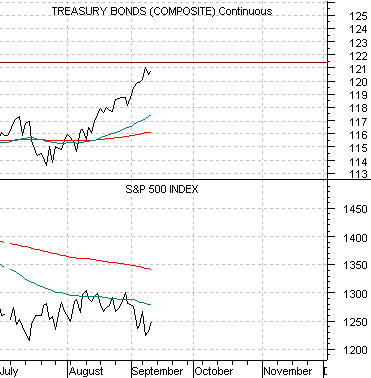
In the midst of the Lehman melt down the U.S. 30-year T-Bond futures are challenging the highs set in both January and March at a price of just over 121. With this in mind we return to the chart-based argument that we featured yesterday by starting off below with a comparison from 1982.
The chart shows the U.S. 30-year T-Bond futures and the S&P 500 Index. The argument is that the equity markets turned from bearish to bullish following a break through price resistance by the TBond futures.
The current situation is shown below right. The September TBond futures touched 121 15.5/32 yesterday and closed at 120 27/32.
In a sense the point is that the current position of the long end of the Treasury market may well be equity markets bullish no matter what happens. In other words if the TBonds break nicely above 121-122 then the set up is in some way similar to August of 1982. On the other hand if the TBonds turn lower from current levels then we have something of a repeat of this past January and March.
When the TBonds turned lower in January the SPX pivoted upwards from an intraday low of around 1270 to a high just above 1390. At the peak for the TBonds in March the SPX rose from an intraday low close to 1260 to an intraday high north of 1430 in May.
Our view is that higher bond prices would lead to a more sustained equity markets rally but only if the decline in interest rates came from declining commodity prices instead of a renewed sense of crisis in the banking sector. In other words stronger equities based on an expansion of valuation levels with early strength concentrated in the non-commodity sectors would lead to a recovery with greater ‘legs’ although recent history has shown that the equity markets are more than capable of snapping to the upside on falling Treasury prices if weakness is the result of a calming of fears with respect to financials.
Equity/Bond Markets
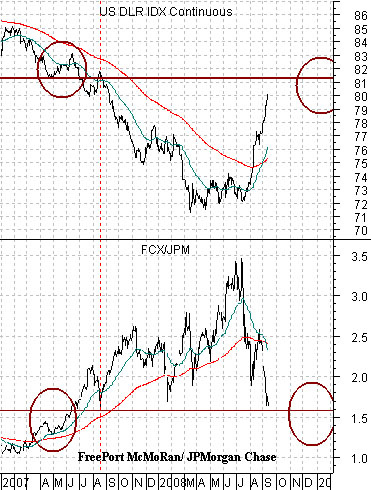
The chartbelow compares the U.S.Dollar Index (DXY) futures and the ratio between copper miner FreePort McMoRan (FCX) and JPMorgan Chase (JPM).
We have shown this chart on a number of occasions. Given our tendency to look well out into the future we are doing our best to work with the arguments that we have been making for some time instead of moving on to something new.
The argument here is that a fairly understandable and, in our view, rational readjustment of relative prices turned into a price bubble last year as the U.S. Dollar Index broke below roughly 82.
We argued years ago that the commodity sector had been left behind during the 1995- 2000 time period and that the next trend would favor commodities and the stock prices of the commodity producers. The trend had generally done all- and more- than we had expected into 2007 before exploding to the upside on dollar weakness. However, from the end of this year’s second quarter the markets have worked hard at removing the bubble as the dollar has moved back into the low 80’s concurrent with a sharp decline in the FCX/JPM ratio. Notice that the FCX/JPM ratio is now very close to the levels of August of 2007 when the DXY was trading between 80 and 82.
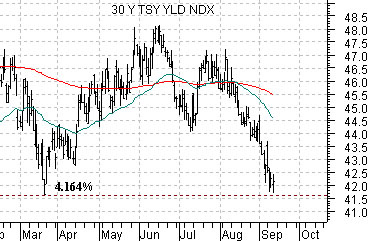
Below we show the yield index for 30-year Treasuries. The point is that it would take a break below 4.16% to make new lows. The intraday bottom yesterday was 4.17% with a close at 4.21%.
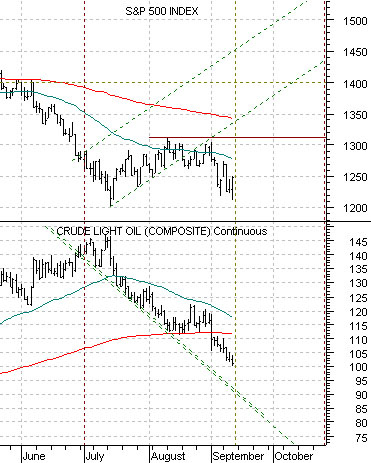
Below is a chart comparison between crude oil futures and the S&P 500 Index (SPX).
Our view is that the trend for equities turned positive when the trend for crude oil futures price turned negative at the end of the second quarter. This means that the SPX has fallen some distance below its rising trading channel. If we are correct then the SPX should simply resolve higher.
Crude oil futures prices may have trouble moving or holding below 100 but our short-term target is still around 88- 90. The SPX will have resistance at the recent highs near 1310 but the true test will come at the 20-day e.m.a. line around 1350. The basic target that we have been using has been a return to a ratio of .22:1 between the CRB Index and SPX. That could be 310 and 1400 or something closer to 330 and 1500. Either way we remain negative on commodities and basically positive on the U.S. equity market.