Sept. 14 (Bloomberg) — Copper fell the most in two weeks as swelling inventories stoked concern that demand might weaken. Stockpiles tracked by the London Metal Exchange gained 0.5 percent today to 319,800 metric tons, the highest since May 26, and are up 7 percent this month. In Shanghai, they rose 12 percent last week to 97,396 tons, the highest since June 2007.
Sept. 14 (Bloomberg) — Gasoline fell to an eight-week low on speculation that the U.S. market is oversupplied with motor fuel after the end of peak driving season.
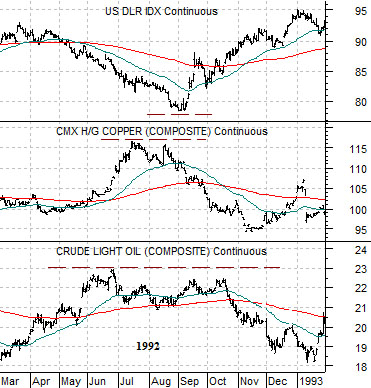
Aside from last year’s dollar rally the last two major bottoms for the greenback were made in 1992 and 1995. Today we return to 1992 to show how the U.S. Dollar Index (DXY), copper futures, and crude oil futures look by way of comparison.
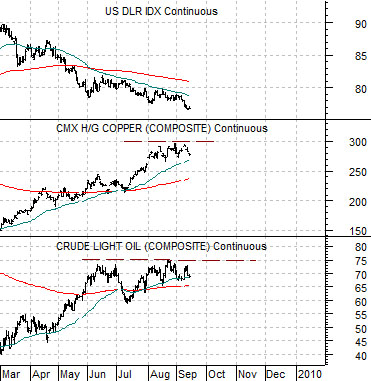
The chart below compares the DXY futures, copper futures, and crude oil futures from March of 1992 into January of 1993 while the chart below features the same three markets starting in March of this year.
The first point would be that a dollar bottom requires a similar top for copper and crude oil futures. The more shaky the trend for energy and metals prices the higher the odds that the dollar is approaching a low.
The second point would be that a peak in either copper or crude oil futures requires an earlier top in the other. In other words… whether copper or crude oil tops first is largely irrelevant but one of the two has to flatten out to slow the ascent of the other. The highs for crude oil futures, for example, were made in June of 1992 with copper futures pushing on to new highs into the following month. Once oil prices flattened out and copper prices began to tumble back towards the 200-day moving average line the stage was set for an upward pivot in the dollar.
With crude oil futures trading sideways below the 74- 75 level since June and copper showing indications of struggling after the recent push up to 3.00 the stage is theoretically set for dollar strength.
If we take the comparison literally… the next piece of the puzzle that should fall into place would be a break back to or below around 2.50 for copper futures in front of a much larger decline that would eventually give back most (if not all) of the gains recorded since the lift up from 1.50 in March.
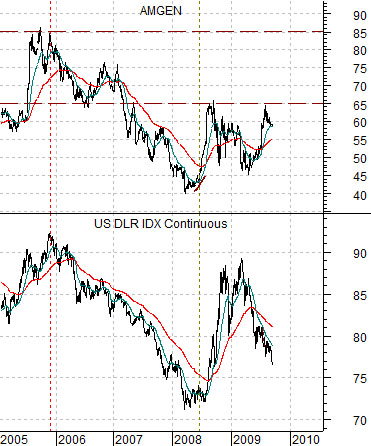
In past issues we have shown how the share price of Amgen (AMGN) tends to lead the S&P 500 Index (SPX) to the upside by around 8 months at major bottoms. We argued, for example, that the mid-2008 low for AMGN preceded the March 2009 bottom for the SPX by the standard length of time.
We have also suggested- somewhat tentatively- that the sell off in AMGN’s share price from the 65 highs in 2008 to the 45 lows in 2009 makes the argument that the broad stock market will remain under pressure into January of next year.
Aside from all of that we also use AMGN for some of our work on the U.S. dollar. The idea is that AMGN has tended to swing very closely with the dollar so the higher it pushes the greater the chances of imminent dollar strength.
Below we show a comparison between AMGN and the DXY futures from 2005 to the present day.
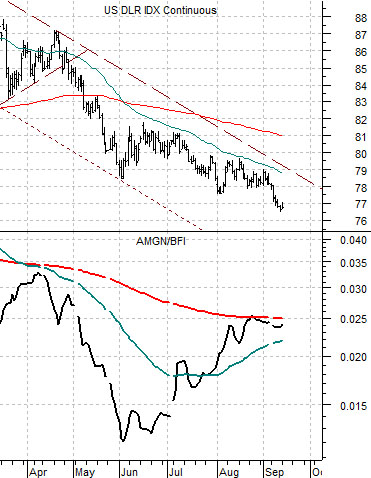
Given our apparent need to fixate on seemingly irrelevant details we put together a combination of AMGN and the Baltic Dry Index several years ago and have used it with some success to get a sense of the dollar’s near-term trend.
The argument is that AMGN trends with the dollar while ocean freight rates trend inversely to the dollar. A rising trend for AMGN is a positive for the dollar while falling ocean freight rates are also a negative. This means that as long as the ratio between AMGN and the Baltic Dry Index (BFI) is declining the dollar will be weaker. When the ratio makes a bottom and turns higher the dollar tends to flatten out and by the time the ratio breaks up through the 200-day exponential moving average line (red line on chart) the dollar is set to swing upwards.
Below we feature a comparative view between the U.S. Dollar Index futures and the ratio between Amgen and the Baltic Dry Index.
The ratio bottomed in early June (concurrent with the initial push to 74 by crude oil futures prices) and has been trending higher ever since. Last month, however, the ratio reached the moving average line and literally stopped dead in its tracks suggesting at least the potential for a replay of April’s swoon that marked the start of a 10% hair cut for the DXY from 87 down to just below 79.
Our point is that in terms of our work the dollar has done just about everything that one would expect to be required to carve out a bottom with the possible exception of actually stopping moving lower. The share price of AMGN has begun to firm, ocean freight rates are lower, and the ratio has covered all of the ground between itself and its 200-day moving average line. What remains, however, is the most important part- an actual push above the moving average line with enough momentum to mark the start of a trend that will last for more than a day or three.
Our thought is that AMGN above 60 would be helpful but ultimately the share price is going to have to move above 65 and at least threaten the 2005 highs close to 85.