We noted a few days back that the markets might have to deal with a bit of chaos following today’s Federal Open Market Committee rate decision. We observed that the Fed had embarked on the first of a series of interest rate increases in the past nine months after long-term Treasury yields had begun to rise so, while difficult to believe, it was possible that a meeting that most view as a non-event could prove to be anything but.
Our thought was that if the response following the Fed decision led to a sharply higher U.S. currency then the U.S. Dollar Index would be on its way towards the 83- 84 region. To the extent that foreign equity markets and commodity prices have been feeding off of the weaker dollar this could lead into some serious relative price adjustments.
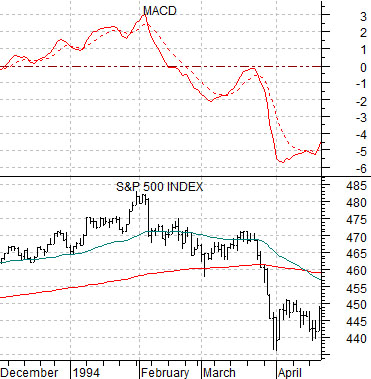
Below we show the S&P 500 Index (SPX) from 1994 along with an accompanying MACD indicator. Below right is a chart of China’s Shanghai Composite Index plus a similar MACD indicator.
The argument is that the ‘look’ of the Shanghai Comp. through trading on Tuesday is virtually identical to that of the SPX back in March of 1994. The SPX peaked at the start of February in 1994- one month into the start of a new quarter- and pivoted upwards at the start of March. The Shanghai Comp. topped out at the start of August before swinging higher in early September.
The 1994 SPX example is interesting in a couple of respects. First, because it represents one of the very few times that a market has buckled during the final week of a quarter. Second, because we suspect that few even recall the ‘crash of 1994’. It was, in fact, a fairly minor (albeit quick) 10% ‘hair cut’ for the S&P 500 Index in front of the major bull market that began towards the end of that year.
Pressure on the equity markets during the spring of 1994 came from rising energy and metals prices and falling bond prices and a weaker dollar. In other words, a fairly similar back drop to today’s situation.
As mentioned in previous issues the odds of a cascading decline in a major equity market in front of quarter end are not great. Such events- when they occur- tend to happen early in a new quarter especially during the month of October. For now, however, the charts remain similar enough to warrant at least some amount of focus as the September Fed meeting approaches its conclusion.
Equity/Bond Markets
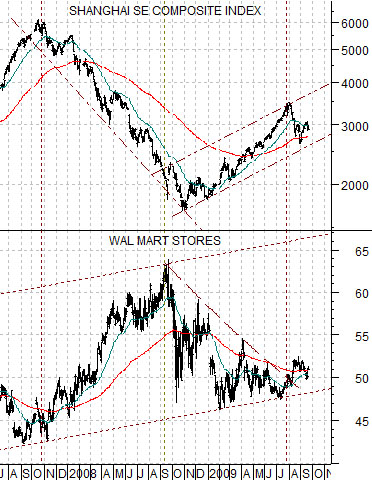
Below is a comparative view of the Shanghai Composite Index and the share price of Wal Mart (WMT).
We realize and recognize that we are fixating on the Shanghai Comp. these days but we will argue that until the markets tell us that we are wrong to do so… it makes sense to continue gnawing on this bone.
To explain… at the top for the Shanghai Comp. in 2007 the share price of WMT began to lift and as the process continued WMT worked up through its 200-day moving average line. The chart at right shows that something similar has been occurring over the past month or so. WMT has lifted just high enough to get on the north side of its moving average line.
Below we show the Shanghai Comp. and the ratio between the Baltic Dry Index (BFI) and crude oil futures.
The argument made several days ago was that the BFI/crude oil ratio tracks very closely with the Chinese equity markets. To the extent that this ratio has just made new lows we can at least make a case that downward pressure remains for the Shanghai Comp.
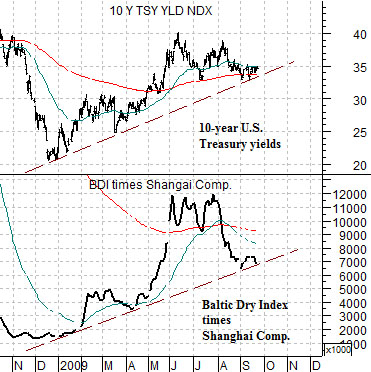
Below is yet another spin on the Shanghai Comp. and Baltic Dry Index. In this example we compare the yield index for 10-year U.S. Treasuries with the product or combination of ocean dry bulk cargo shipping rates times the Shanghai Comp.
The argument is that there are two economically sensitive or cyclical markets (ocean freight rates and Chinese shares) that are putting downward pressure on yields (and therefore, in a strange way, helping to support gold prices through a stronger bond market). Through trading yesterday 10-year yields were still holding the rising trend line with support just under 3.3% while the BDI times Shanghai Comp. had returned to the rising trend line that has gone with strong cyclical growth and higher interest rates this year.