In recent weeks we have focused on the similarities between the current situation and 2008 and then pushed on with our argument that, in fact, the set up is almost exactly the opposite of that time period. The problem with our thesis is that the markets have yet to be ‘surprised’ by indications of economic strength.
Our basic premise was that 2008’s melt down was somewhat inevitable given 2007’s yield curve inversion. An inverted yield curve acts as a brake on growth. The situation in 2011, on the other hand, should be somewhat different given that the yield spread reached a stimulative peak in 2010.
As we have mentioned on a number of occasions we can well understand why investors would be nervous at this juncture. As long as U.S. employment data continues to reflect slowing growth there is no reason to expect a trend shift away from falling yields, cyclical weakness, and downward pressure on the financial sector. That was most definitely the case yesterday.
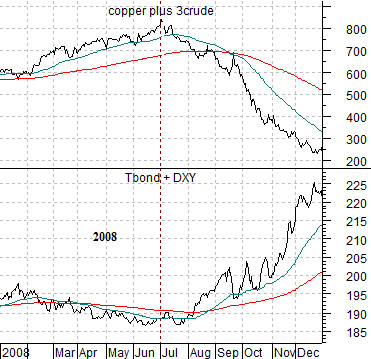
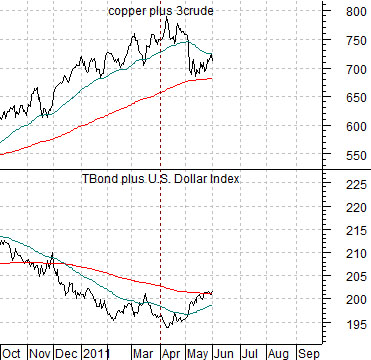
Below is a chart comparison between the sum of copper and crude oil (copper in cents plus crude oil in dollars (times 3)) and the sum of the U.S. 30-year T-Bond futures and U.S. Dollar Index (DXY) futures from 2008. Next is the same chart from the current time frame.
Our argument has been that we are setting up for a stronger dollar and a weaker bond market. The cyclical trend, on the other hand, has been feeding off of the kind of commodity price strength associated with a weaker dollar.
We are not sure whether a strong dollar AND strong bond market is the worst of all possible outcomes given that this combination led to a major equity bull market back in 1995 but… from the perspective of 2008 it certainly does present a challenge for those inclined towards a bullish point of view.
The point is that in the middle of 2008 the sum of the dollar and the TBonds began to rise as an offset for serious downward pressure in base metal and energy prices. Since the end of the first quarter this year the markets have been resolving in an almost identical fashion which, if nothing changes in the very near term, put the rising trend for commodities and equities at very serious risk.
Equity/Bond Markets
June 1 (Bloomberg) — Stocks slid, halting a four-day gain for the Standard & Poor’s 500 Index, and Treasuries rallied as slower growth in jobs and manufacturing fueled concern that the economy is faltering. The dollar and commodities fell.
Between now and the end of this week we will see the weekly initial jobless claims report and the monthly U.S. employment data. We got a good taste yesterday of how the markets will be inclined to react if both data sets point to slumping growth.
We thought that it might be appropriate at this juncture to hammer away at the difference between what IS happening and what we have argued MIGHT happen. Let’s set the stage somewhat first.
There are four combinations of the dollar and bond market to consider. Any combination that includes dollar weakness will support the commodity markets while dollar strength tends to put pressure on raw materials prices. Any combination that includes stronger bond prices tends to favor defensive sectors while a weaker bond market shifts strength to the cyclical stocks.
A strong dollar and strong bond market favors consumer stocks. A weak dollar and strong bond market favors gold. A strong dollar and weak bond market favors non-commodity cyclicals (tech, autos, energy users, etc.), while a weak dollar and weak bond market is all about commodities with an emphasis on the base metals.
What we have had is a weak dollar and strong bond market. This is the kind of trend that seriously favors gold. What we appear to be shifting into a stronger dollar and bond market which is the intermarket set up that favors the consumer non-durable/non-discretionary sectors. Where we expected the markets to shift to- perhaps during the third quarter of this year- is a stronger dollar and weaker bond market. To get from here to there… something first has to change.
Let’s deal with the here and now. While we expect the bond market to peak and turn lower… it is still driving to the upside.
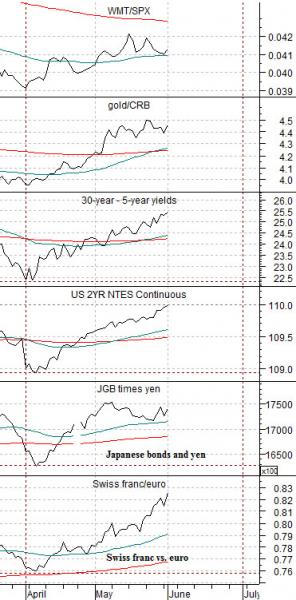
Below is a comparison, from bottom to top, of the cross rate between the Swiss franc and euro, the Japanese 10-year (JGB) bond futures times the Japanese yen, the U.S. 2-year T-Note futures, the yield spread between 30-year and 5-year Treasuries, the ratio between gold and the CRB Index, and the ratio between Wal Mart (WMT) and the S&P 500 Index (SPX).
All six markets are following the same trend. The franc is rising against the euro, the Japanese yen and bond market is somewhat stronger, short-term U.S. bonds are rising in price, the yield spread is widening, gold remains relatively strong, and Wal Mart is better than the broad market. Keep in mind that what we are showing is ‘the current trend’. This is what is working at present.
Our argument is that all of these trends will turn lower in response to ‘surprising’ economic strength. The reality is that none of these trends has yet to turn lower so we are presenting a thesis regarding a potential trend change that has clearly not yet begun. An argument in favor of the financial stocks and Japan necessarily requires a weaker bond market and to date the bond market is still driving to the upside.