We noticed the following comments on Bloomberg.com yesterday, ‘Goldman Sachs Group Inc. and Bank of America Corp. say a weaker-than-forecast June jobs gain in the U.S. will lead the Federal Reserve to keep its benchmark interest rate at almost zero until the middle of 2015.’
We have absolutely no idea whether this will prove correct or not but given our view that it makes more sense to forecast the economy off of the financial markets than to attempt to trade the markets off of an economic forecast… we have our doubts.
The argument is that coming off the bottom the stock market will lead, the bond market will eventually break lower to mark the point where the equity markets shift focus from the defensive and interest rate sensitive sectors over the cyclicals, and then a year later central banks will realize that it is time to start raising benchmark interest rates.
We have noted in the past that we believe the trend is still ‘in between’. In between the recovery in the defensive sectors and the impending shift over to the cyclicals. In between the start of a rising trend for equities and the start of a declining trend for bond prices.
If, in fact, the Fed is on hold until the middle of 2015 then a quick bit of reverse engineering argues that the bond market will continue to push upwards for another two years (long-term yields turn higher a year ahead of the first Fed rate hike). All things are possible, we suppose, but that is something of a stretch.
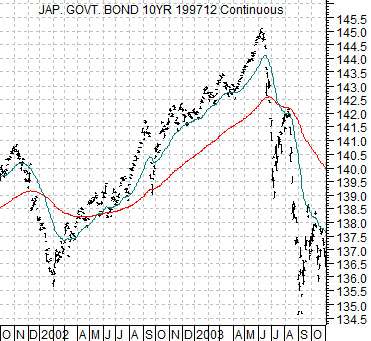
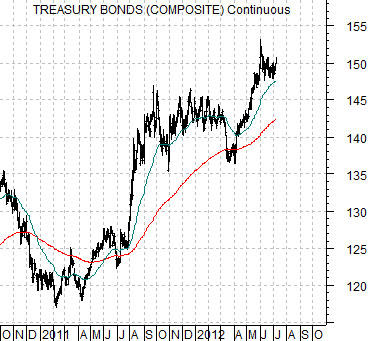
Below is a chart from 2001- 03 of the Japanese 10-year (JGB) bond futures. Next is a chart of the U.S. 30-year T-Bond futures from 2010 to the present day.
The Bank of Japan hammered interest rates down towards 0% in 2001 and it took a bit more than 2 years before the long end of the Japanese bond market stopped rising and began to tumble. We thought it might be interesting to compare the trend for Japanese bond prices during 2002 and 2003 with the recent trend for long-term Treasury prices. The point is that if we start to see marked strength in some of the cyclical equity sectors then we wouldn’t be too surprised to see the TBond futures retreat all the way back to the levels of early 2011.
Equity/Bond Markets
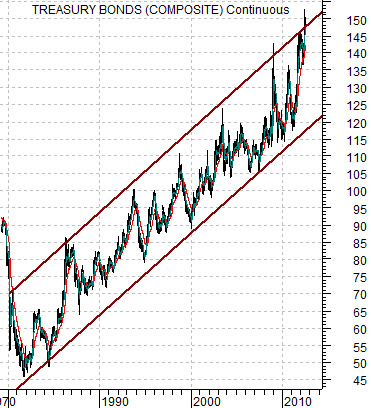
Let’s attempt to find a bit of perspective. At top right is a chart of the U.S. 30-year T-Bond futures from 1979 to the present day.
Within the context of the rising trading channel the price of the TBond futures is ‘high’. In fact it is at or above the channel top. This doesn’t mean that prices can not go higher but it does make sense to at least consider the possibility.
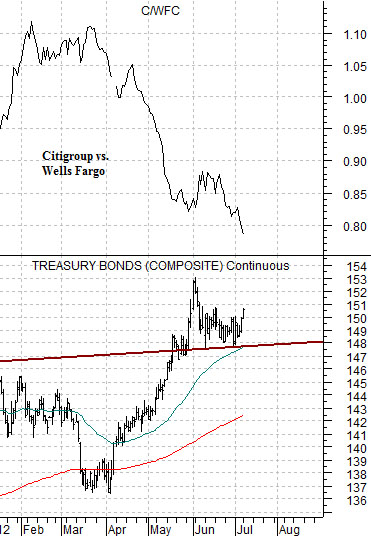
At bottom is a comparison between the TBond futures and the ratio between the share prices of Citigroup (C) and Wells Fargo (WFC). If all goes well the TBond futures chart will include the top channel line from the longer-term perspective.
On the one hand… the TBonds are north of the channel top. On the other hand… a downward trend for bond prices should include a rising C/WFC ratio as the laggard banks start to show relative strength against the leading banks.
This leaves us with a markets trend driven by rising bond prices but one that is as extended as at any time in the last few decades. Bond prices can always go higher but within the context of the longer-term trend the path of least resistance does seem to be back down towards the bottom of the trading range closer to 120.
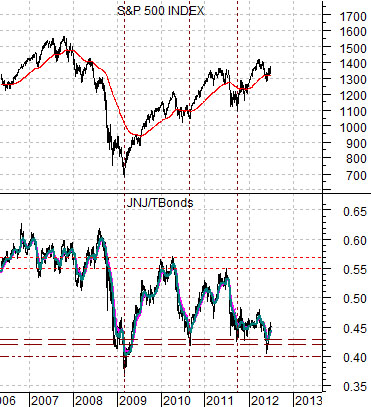
As bond prices rise the floor under the broad U.S. large cap market rises as well; at least for those companies that are not directly related to the problems that are pushing yields lower.
The ratio between Johnson and Johnson (JNJ) and the TBond futures tends to rise with the S&P 500 Index. While each peak since 2008 has been somewhat lower the argument is that the defensive stocks (i.e. JNJ) still have considerable upside room given the extent of the upward price adjustment for long-term bond prices.