This is going to be a busy week for earnings. We start things off today with Wells Fargo, Citigroup, and IBM followed tomorrow by Intel and Apple, Coke and Johnson and Johnson, along with Goldman Sachs and Bank of America. In the space of two trading days we will get a very good look at how business is looking for the financials, multinational consumer products, and tech sectors.
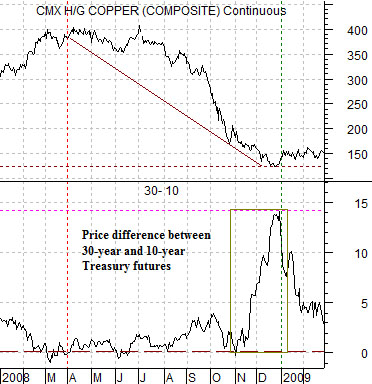
We return to an argument that we made a few weeks back based on the cyclical trend and the bond market. For the ‘cyclical trend’ we are going to use copper futures while for the ‘bond market’ we have chosen to focus on the price spread or difference between the 30-year and 10-year Treasury futures. The price spread trends ‘with’ the bond market as it rises as bond prices move upwards and falls as bond prices in general decline.
First up is a chart from 2008- 09 which compares copper futures with the 30- 10 price spread.
The peak for the cycle was made in March of 2008 with the bond price spread fairly close to ‘0’. This means that the prices of the 30-year T-Bond futures and 10-year T-Note futures were close to identical.
The cycle bottomed nine months later at the low point for copper as the bond price spread made a frantic 2-month rally up over +14. Fair enough.
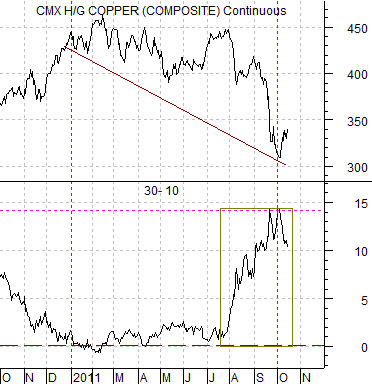
Next is the same comparison from October of 2010 to the present day. The cycle peaked around the start of this year as copper prices topped out during the first quarter. The correction ran for the next nine months concluding with yet another frantic 2-month rise in the bond price spread to… a bit over +14.
This perspective generates two arguments. First, the market’s trend at the end of September this year was similar to the end of 2008 which, we would suggest, is fairly comforting. Second, recent corrections for the cyclical trend have started with the bond price spread close to or below ‘0’.
The point is that if cyclical bottoms are being made when the price spread spikes above +14 and tops are being made with the price spread below 0 then- at most- we are roughly 25% of the way through the current recovery.
Equity/Bond Markets
There are probably more interesting and timely perspectives to show but with such heavyweight earnings due out we thought that we would hold to more macro themes for another day or so.
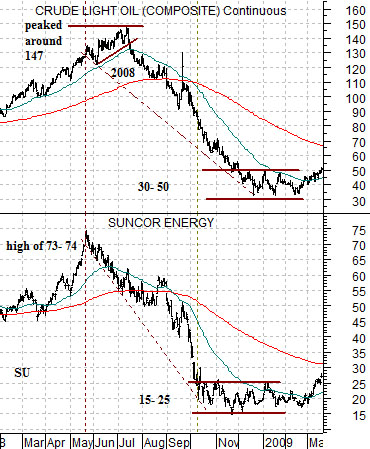
On occasion we show a chart based on the price spread or difference between 2 times the share price of Suncor (SU) and crude oil futures. We haven’t done this one in awhile so we are going to explain where the idea originally came from.
The argument is that Suncor’s share price ‘should’ be about one half the price of crude oil. In reality, of course, it is either higher or lower than that virtually all the time.
Our view is that the oil stocks actually lead oil prices. On any given day one will read that oil stocks rose because oil prices were stronger or fell because oil prices were weaker but over time the oil stocks lead oil prices in much the same way that the stock market leads the economy.
We argue from time to time that it makes more sense to forecast the economy off of the stock market than to forecast the stock market off of the economy. In other words… pay more attention to the message of the markets than the ramblings of economists.
The price peak for Suncor in May of 2008 was very close to 78. The price of crude oil futures reached a high a couple of months later around 147. The top for Suncor was almost exactly 50% of the cycle top for crude oil.
By the fourth quarter of 2008 the price of Suncor settled into a range between 15 and 25. This suggested that oil prices could decline until a trading range around 40 was established. This marked the general price for crude oil between December of 2008 and February of 2009.
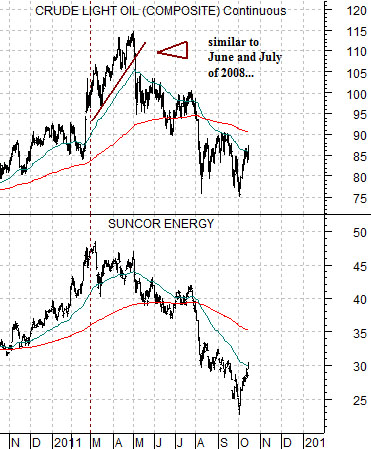
So… fast forward to the current year. Below right we have included a chart of crude oil and the share price of Suncor from the present time frame.
The first detail to notice is that SU peaked in March of this year around 48. Crude oil continued to rise for another couple of months (similar to June and July of 2008) until reaching a high at the end of April at roughly 115.
Obviously something has changed because 2 times the peak for Suncor would argue that crude oil prices were going to top out around 96. Our thought is that this has much to do with the situation in Libya.
Cutting to the chase the premise is that the oil stocks ‘lead’ oil prices. If so then the oil stocks shouldn’t rally on stronger oil prices as much as oil prices will recover on rising oil stock prices.
The chart below shows how Suncor peaked a couple of months ahead of oil prices in 2008 and established a bottoming trading range a couple of months before oil prices reached a low later that year. Earlier this year SU turned lower two months ahead of the peak for crude oil futures prices so, if history repeats, we really shouldn’t see much stronger oil prices until SU has been trending steadily higher for at least two months. Until that time there is the persistent risk that the Libyan situation settles down leading to the end of the premium for Brent crude oil futures over WTI that is helping to hold oil prices at higher than expected levels.