Just below is a chart comparison between the U.S. 30-year T-Bond futures and the spread or price difference between the 30-year and 10-year (30- 10) Treasury futures.
We often show the trend for the bond market through the 30- 10 spread. It has been some time since we last showed this relationship so we thought it might make sense to include a quick explanation.
The price spread between the 30-year and 10-year Treasury futures trends with the bond market. When bond prices are rising the spread increases and when bond prices are falling the spread contracts.
Featuring the spread instead of actual bond prices comes in handy at times. Notice on the chart that the spread bottomed repeatedly between 0 and -1 through 2008. This corresponded with price support for the TBond futures between 114 and 115.
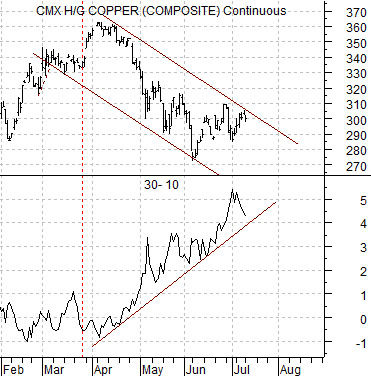
Further below is a comparative view of copper futures and the 30- 10 price spread.
Copper prices are one of the key cyclical markets that tend to drive interest rates higher and lower. Copper tends to trend quite closely with Asian growth so we have argued that the Shanghai Composite Index is usually positive as long as copper prices are outperforming crude oil prices.
The chart below shows that bond prices have been moving higher since late March as an offset to a declining trend for copper prices. There are a number of ways that bond prices could swing lower in the weeks to come but one of the more obvious would be through strength in copper prices.
The argument here is that copper is trending lower in a fairly well defined trading channel and as copper prices decline the bond market is lifting in price. To alter or reverse the trend copper futures prices would ‘simply’ have to break through the top of the trading channel. Something north of 3.05 would probably do it although a close above 3.10 would be more conclusive. With copper futures ending last week right at the channel top we started off the current week with enough a price correction to maintain the bearish trend while helping to support the bond market.

Equity/Bond Markets
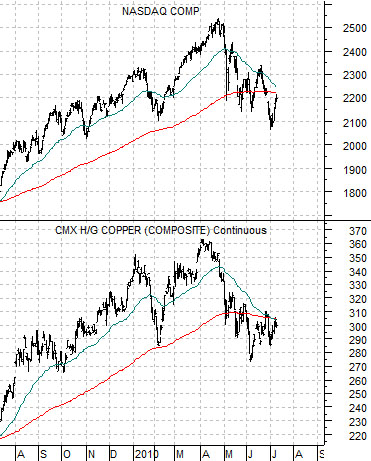
From time to time we write that ‘cyclical is cyclical’. What we mean by this is that economically sensitive sectors tend to rise and fall in tandem. An example is shown below using a chart of the Nasdaq Composite Index and copper futures.
The charts are virtually identical suggesting that regardless of the merits of tech and base metals the markets have been pushing both higher and lower at the same time.
Where things get particularly interesting (to us at least) is when one or more cyclical markets diverge. In other words there are periods of time when one sector trends lower while another trends higher. This is often true with respect to energy prices and the energy ‘using’ themes (autos and airlines for example).
Below is a chart comparison between copper futures and the Nasdaq Composite Index from 1994 into early 2003.
The point is that between 1995 and early 1999 the trend for copper was clearly lower while the trend for the Nasdaq was powerfully higher. Our sense is that the trend for the Nasdaq was so strong that it literally pulled money away from other competing themes. We will argue that something similar happened during the final few years of the previous decade as commodity price strength in general and energy price strength in particular overwhelmed most of the other competing cyclical themes.
In any event… below is a chart of the U.S. Dollar Index (DXY) futures and the ratio between the Philadelphia Semiconductor Index (SOX) and copper futures.
In 1995 as the Nasdaq lifted higher even as copper prices turned lower the SOX/copper ratio started to rise. This marked the start of a bull market for the U.S. dollar as money began to shift towards the U.S. in search of tech-related investment alternatives. From a number of different perspectives 2010 is somewhat similar to 1995 as the SOX/copper ratio swings higher once again after giving back all of the relative strength gains made between 1995 and 2000 over the ensuing decade.