This is a particularly challenging markets environment. While we have yet to encounter a simple or easy markets situation it still feels as if the current set up is almost bipolar. On the one hand it feels at times as if we are in the very early stages of a new equities bull market similar to 2003 while on the other hand a case can be made that we are approaching a cyclical peak in front of a long downward slide. Chances are that it is a combination of both of these as new themes rise to the forefront while old favorites return to the scrap heap.
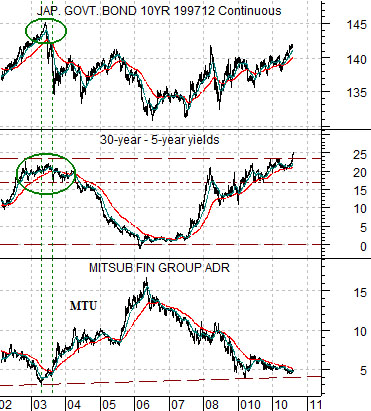
Below is a comparison between the Japanese 10-year bond futures, the spread between 30-year and 5-year U.S. Treasury yields, and the share price of Japanese bank Mitsubishi UFJ (MTU).
This chart hints that the current situation is similar to 2003. The Japanese bond futures are pushing to some kind of peak- similar to 2003- while MTU tests the lows. The spread between 30-year and 5-year Treasury yields has recently made new highs in a manner reminiscent of the second quarter of 2003.
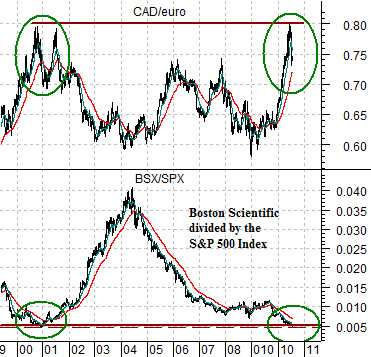
Below we show a comparison between two ratios. The chart includes the cross rate between the Canadian dollar and euro (CAD/euro) and the ratio between the share price of medical products maker Boston Scientific (BSX) and the S&P 500 Index (SPX).
When we view this perspective we come away with the sense that things are quite similar to early 2001. The CAD/euro cross rate has recently snapped down from its recent test of the upper end of the trading range while the BSX/SPX ratio has declined all the way back to the lows set at the end of 2000.
Finally, the chart suggests that the equity markets are in the very early stages of a rally that should extend well into 2011. The set up argues that bond price strength will fade as we move deeper into the quarter followed by falling bond prices into the first Fed funds rate increase in 2011. The chart below right, on the other hand, hints at the possibility of a cyclical peak focused in the commodities sector as the Cdn dollar resolves lower over time versus the euro. An upward swing in the BSX/SPX ratio would result as money previously crowding into the commodities sector starts to migrate back towards the kind of stocks that have started to report above consensus earnings (like BSX). All in all our comparisons point to a bit of this and a bit of that which makes our work particularly challenging.
Equity/Bond Markets
Above we attempted to show that if we look at the markets from one perspective we get the sense that we are poised on the verge of a major cyclical expansion (2003) while from a different angle it looks as if we are teetering on the edge (2001). Strangely enough… the recent run up for long-term Treasury prices supports both arguments quite nicely.
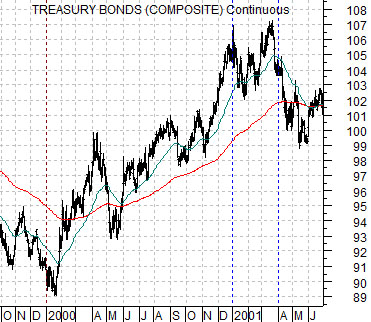
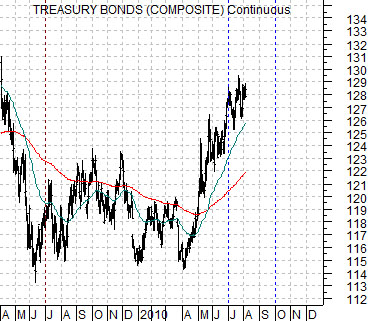
To explain… at right we have included three charts of the U.S. 30-year T-Bond futures.
The comparison between the CAD/euro and BSX/SPX suggests that today is similar to the first quarter of 2001. The chart at top right shows that the TBonds rose in price from January of 2000 into the first quarter of 2001.
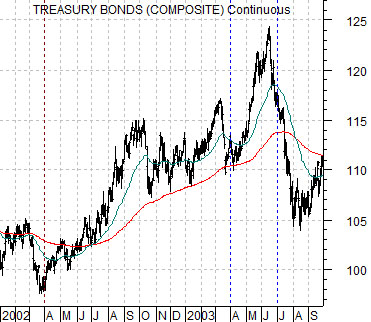
The comparison between the JGBs, 30-year minus 3-year yield spread, and MTU argues that conditions are closer to the second quarter of 2003. The TBond chart at middle right shows that bond prices turned upwards at the end of the first quarter of 2002 only to reach a peak during the second quarter of 2003.
Below we show the current situation. Notice that a case can be made that the TBonds turned higher around the middle of 2009 and are now entering the 5th quarter of a rising trend similar in many ways to early 2001 and mid-2003. The point? Either way the bond market could remain stronger into September but the charts suggest that we will see marked weakness for prices into the fourth quarter.
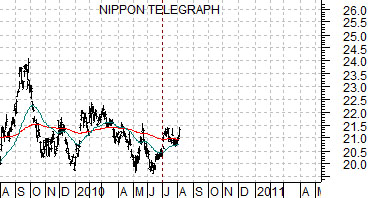
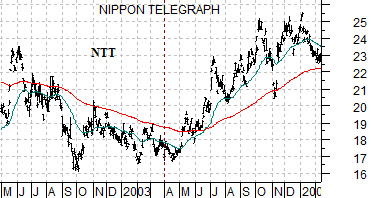
When the bond market AND the yen are stronger the share price of Japan’s Nippon Tel (NTT) tends to do well. Below we show a chart of NTT from today as well as from 2003. Our intent is to point out that the trend for NTT today is very close to the one that began to emerge during the second quarter of 2003.