July 27 (Bloomberg) — The highest inflation-adjusted yields in 15 years are helping provide the Treasury with record demand at auctions as the U.S. prepares to sell $115 billion of notes this week.
Treasuries are the cheapest relative to inflation since 1994 after consumer prices fell 1.4 percent in June from a year earlier. The real yield, or the difference between rates on government securities and inflation, for 10-year notes was 5.10 percent today, compared with an average of 2.74 percent over the past 20 years.
We will start off today with the premise that real long-term U.S. Treasury yields are ‘high’. We grant that any discussion about real interest rates involves accepting at face value reported inflation levels but since that is not our point we will push on.
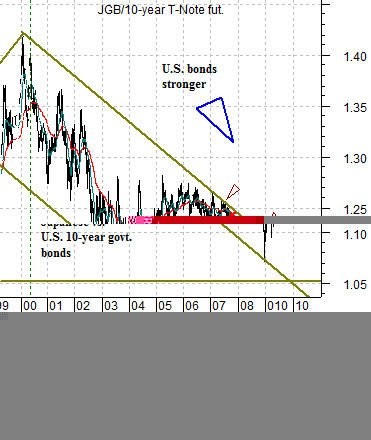
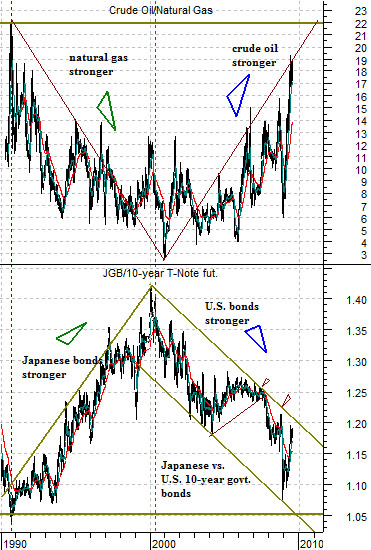
Below is a comparative chart that has graced these pages on a few occasions in the past. The chart compares the ratio between crude oil and natural gas futures with the ratio between Japanese and U.S. 10-year government bond futures.
Our argument is that this chart represents the long-term trend. Through the 1990’s Japanese economic growth lagged behind U.S. growth which led to a decade-long increase in the ratio between Japanese and U.S. bond prices. A rising JGB/T-Note ratio depicts falling Japanese yields relative to U.S. yields.
With the U.S. stronger than Japan the trend for natural gas prices rose relative to crude oil prices. From 1990 into 2000 the U.S. bond market under performed the Japanese bond market while natural gas prices rose relative to crude oil prices.
Following the Nasdaq’s peak in 2000 the trend reversed as the JGB/T-Note ratio began to decline. Through the current decade U.S. bond prices have risen relative to Japanese bond prices while crude oil prices have been stronger than natural gas prices. In a sense the trend has come full circle as the crude oil/natural gas ratio pushes back towards the peak levels associated with the Gulf War.
Our point is that there is a massive trend within the markets that is pulling long-term Treasury yields down towards similar Japanese yields. Consider, for example, that 10-year JGB yields are currently just below 1.4%. If U.S. ‘real’ yields were simply at the 20-year average of 2.74% and if we accept that the inflation rate is -1.4% then, in essence, 10-year U.S. yields should actually be very close to 1.4%.
Equity/Bond Markets
Our argument today is that the markets have spent the last ten years grinding U.S. yields down towards Japanese yields. The idea is not so difficult to accept once one realizes that last year’s series of crises resulted in the Fed employing a 0% interest rate policy.
The point is that 10-year Treasury yields ‘should’ be closer to 1.4% instead of 3.7%.
The next issue is… if 10-year yields should be falling towards 1.4% instead of rising through 3.7%… what happens next? One answer would be Crisis Part 3.
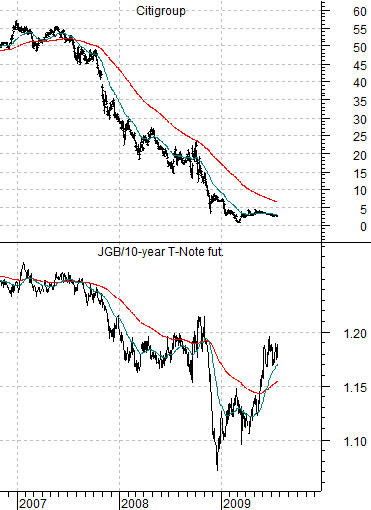
Below we show the JGB/T-Note ratio from 1999 to the present day. The idea here is that the closer the ratio gets to the top of the downward sloping channel line… the greater the pressure on both the trend and the markets.
To put this into some form of context we show the ratio along with the share price of Citigroup (C) below right. When the ratio was ‘channel top’ in 2007 it did not turn lower until the financials began to weaken. When the ratio jumped higher in 2008 the second shoe dropped- rather dramatically- in the banking sector.
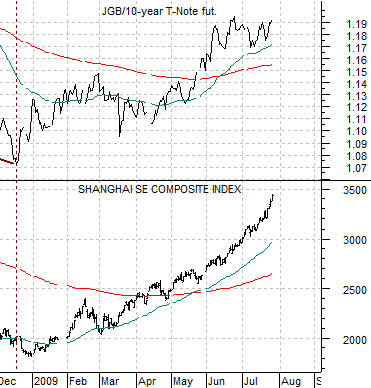
What is driving the ratio higher this year? Cyclical growth. The kind of cyclical growth that involves Chinese equities, base metals prices, and commodity currencies. The chart below compares the JGB/T-Note ratio and the Shanghai Composite Index.
The question remains… if the base trend for long-term Treasury prices is clearly higher but prices keep falling due to strength in cyclical asset prices… what will have to happen before long-term U.S. yields turn lower? A simple answer would be a new series of banking system crises and a collapsing stock market and since that is not the least logical outcome we have to mention it. For those who believe that the glass is half full rather than half empty then another answer will be shown on today’s third page.