What a difference a month makes.
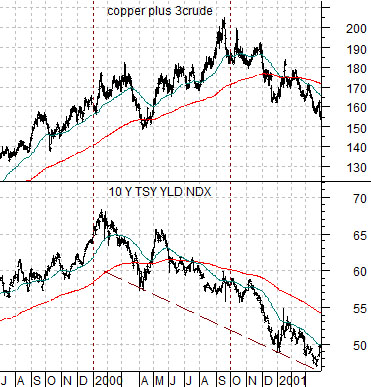
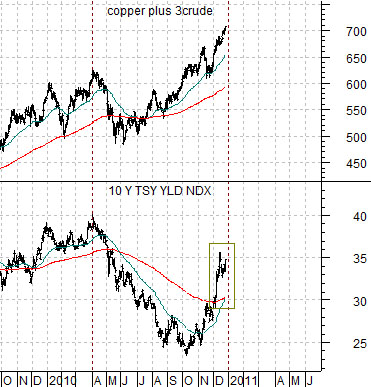
To explain why a month can make all the difference in the world to the markets we start off with the chart at top right of 10-year Treasury yields and the sum of copper and crude oil futures from 1999 into early 2001.
The sum of copper and crude oil consists of copper in cents added to three times the price of crude oil in dollars. This is based on an argument that we have made from time to time that when copper and crude oil have be in balance in recent years copper in cents will tend to equal three times the price of crude oil. Copper will tend to be stronger than crude oil when Asian growth is robust and weaker when the Asian theme starts to turn negative.
In any event… we digress from our point. At the start of 2000 the trend for long-term Treasury yields turned negative. Interest rates started to decline even as base metal and energy prices pushed to their eventual cycle highs. The bond market was, in effect, telling the markets that growth was slowing even as the tail end of the cycle- represented by copper and crude oil- continued to push upwards.
We have argued that this kind of divergence tends to run for about 9 months (3 quarters). As the markets entered the final quarter of 2000 the downward trend for yields was confirmed by weakness in copper and crude oil.
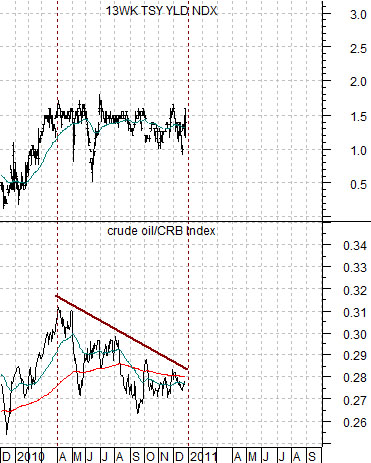
The chart below features the time period from October of 2009 to the present day.
Notice that yields turned sharply lower at the end of this year’s first quarter. Even after rallying back to the 200-day e.m.a. line in early December the trend for yields was still solidly downward which suggested that the dramatic rise in energy and base metals prices may have simply been an end-of-cycle push similar to the second and third quarters of 2000.
The point is that as recently as month ago we could make a fairly compelling case that growth was ready to fall off of the proverbial cliff but with yields exploding up through 3.0% and on to 3.5% it becomes much more difficult make a case that the trend for long-term Treasury yields is still lower. In a matter of only a few weeks the picture has changed from imminently negative to substantially more bullish.
Equity/Bond Markets
So… why are we so utterly twitterpated with the concept of divergences and 9-month lags? Why do we keep showing charts similar to the ones on the first page today along with the crude oil/CRB Index and the commodity currencies? Because our sense is that this might well provide the answers to most of the questions that we have about the markets in 2011 and, perhaps, the answer to the question about the potential for new highs for crude oil futures prices.
Based on a number of factors it appears from a variety of perspectives that the current situation is similar to some time in the second half of 2003. In 2003 the Fed made its final monetary easing the markets responded by pushing the laggard banks higher, selling the bond market lower, and beginning the process of flattening the yield curve. All three situations are almost identical to the response the markets have made since the Fed began its last round of quantitative easing earlier this quarter.
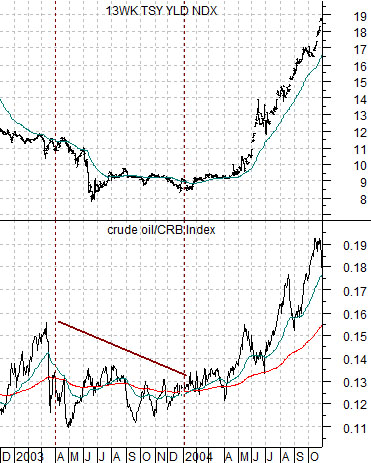
Below we show 3-month TBill yields and the ratio between crude oil and the CRB Index from late 2002 through October of 2004. Note that the Fed cut the funds rate for the final time in June of 2003.
The crude oil/CRB Index trended lower for the final 3 quarters of 2003. This ratio began to rise at the start of 2004 to mark the start of upward pressure on short-term yields. By the time the ratio returned to the peak set in March of 2003 in May of 2004 the trend for TBill yields turned higher followed a month later by the first increase in the funds rate.
The point is that if the recovery continues with long-term yields trending higher then the crude oil/CRB Index ratio is destined to resolve higher. By the time it reaches the highs of last spring we would expect to see 3-month TBill yields pushing above .25% followed by the first (of many) hikes in the funds rate.
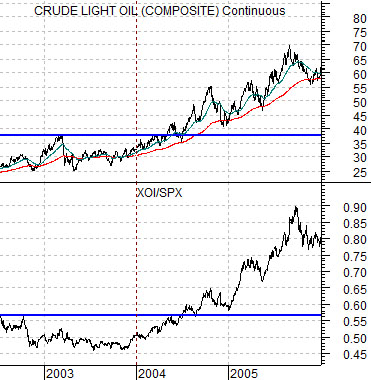
Below we show crude oil futures and the ratio between the Amex Oil Index (XOI) and S&P 500 Index (SPX) between 2002 and 2005. Obviously the oils were markets leaders during 2004 and 2005.