Some time back in the mid-1980’s we attended a sales psychology presentation. The speaker described a house in three different ways- by the way it sounded, the way it felt, and the way it looked. When the audience was asked which of the three they found most appealing we were surprised to discover that roughly one third favored each approach. Why were we surprised? Because our clear choice was based on the way it looked. Only later did we come to appreciate that being a visual processor had more than a little to do with our affinity for charts.
In day to day life the way we process information comes through in our language. People say that they like the looks of something or that an idea sounds good. Often you will hear a person state that something feels right or, perhaps, does not feel right.
If we actually have a point today it might be that while we tend to process information that we receive visually there are times when the markets ‘feel’ similar to some previous point in time. The weakness in the bond market over the past couple of days reminded us of 2004 so that is where we are going to start off.
We appreciate that there are many differences between today and, perhaps, any other time frame. We appreciate that 10-year swap rates (based on AA credits) going below Treasury yields (supposedly a AAA credit) is more than a bit unusual.
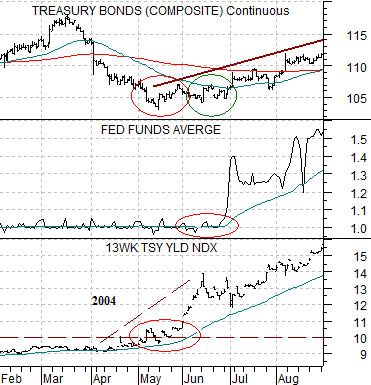
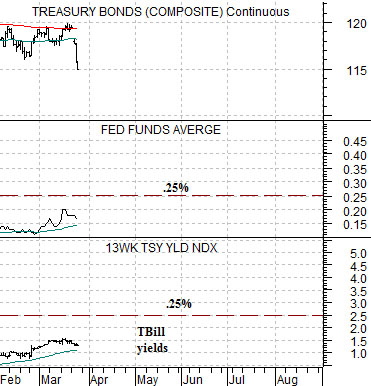
The chart below compares 30-year U.S. T-Bond futures with the Fed funds rate and 3-month U.S. TBill yields from 2004.
The argument is that from March into May bond prices declined in response to the start of a rising trend for TBill yields. At the time TBills were yielding less than the 1% funds rate. By May as the bond market bottomed TBill yields rose above 1% indicating that the Fed would raise the funds rate at the June meeting. Fair enough.
Once the Fed actually raised the funds rate in June the bond market stopped falling and began to rise. Our thought was that this seemed somewhat similar to today as TBill yields work slowly up towards .25%. Until TBill yields rise through this level we expect the bond market to remain under pressure with the next upward swing for prices keyed to the first hike in the funds rate later this year.
Equity/Bond Markets
Gold prices turned higher back in 2001 and ran up through 700 in 2006. From mid-2007 into late 2009 gold prices extended the rally on the way to 1200.
The issue that we have with gold is largely related to what happened after the middle of 2007. In other words the rally from around 650 up to just above 1200.
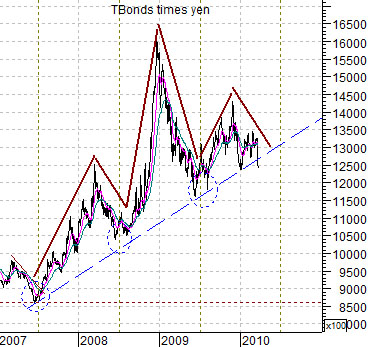
Below we show a chart of the U.S. 30-year T-Bond futures times the Japanese yen futures.
In mid-2007 the bond market and the yen began to rise as an offset to a deteriorating trend for the major banks. The rising trend for the TBonds times yen was tested in 2008 and again in 2009. The chart shows, however, that the combination of downward pressure on the bond market and the yen led to a break of the rising trend this week.
If gold, bonds, and the yen served as destination spots for money moving away from the major banks then weakness in two of these markets suggests at least the potential for pressure in the third. If the TBonds times yen has broken support then argument in favor of lower gold prices makes some sense.
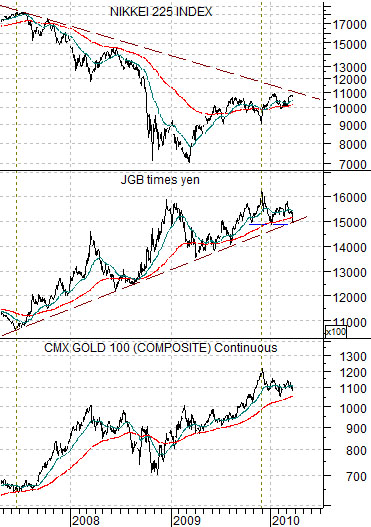
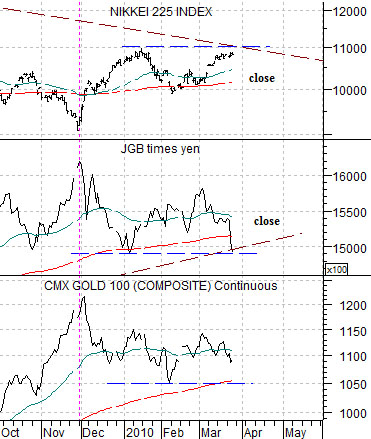
Further below we show the Nikkei 225 Index, the combination of Japanese 10-year bond prices times the yen, and gold futures. We show the same comparison over a much shorter time frame below right.
While the TBonds times yen appears to have broken support the JGBs times yen has simply declined to the rising support line. The key offset to this combination appears to be the Nikkei.
Our thought is that IF the Nikkei 225 Index were to close nicely above 11,000 combined with ongoing strength in the banks then… the major force driving liquidity towards gold will have been eliminated. On one side of the equation we find gold, the yen, and the bond market while the other side includes the Japanese stock market (Nikkei) and the share prices of the major banks (BKX).