We often spend days- even weeks- building a thesis. Some times they even work- to the amazement of all- but on other occasions the markets zig when we have been expecting them to zag. We thought we would run through one of the themes that we were working on earlier this year to show where and how things went awry.
We worry at times that some of our work is focused on comparisons that are a bit too narrow. We use individual stocks to represent broader themes and while this has often worked very nicely every now and then something specific to that particular company will jump up and bite us in the nether regions. Whether this was the case with Amgen (AMGN) earlier this year is still open to debate.
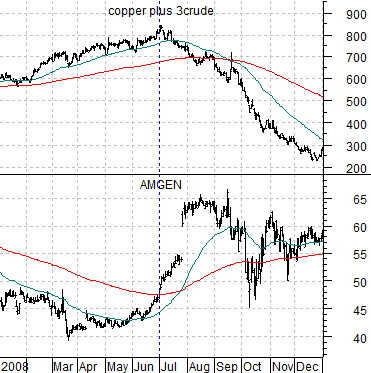
Below we compare the sum of copper futures and crude oil futures with the share price of Amgen. The chart covers the time frame through 2008.
We used this exact example last year as we built a positive dollar thesis even as we struggled to find the top for the commodity markets. The idea was that when AMGN turns higher it has the potential to mark or preceded a dollar bottom. With commodity prices trading inversely to the dollar the view was that strength in AMGN leads to strength in the dollar which, in turn, goes with commodity markets price pressure.
We have also, by the way, argued that AMGN tends to lead the S&P 500 Index by roughly 8 months at the bottoms. A rising trend for AMGN in the second quarter of 2008 suggested an upturn from a bottom for the broad U.S. stock market towards the end of the first quarter of 2009.
In any event… we show the comparison for 2009 below right. Notice how AMGN bottomed out during the second quarter and then spiked up through its moving average line in June. In terms of our thesis this suggested that the dollar was bottoming while energy and metals prices were ready to turn lower to support downward pressure on long-term Treasury yields through the final six months of the year.
As set ups go this was quite a nice one… right up to the point where it didn’t work. After pushing upwards into the summer- in a manner very similar to 2008- the share price of AMGN rolled back to the down side as the markets fought past our thesis returning to the comfort of the ‘China and copper’ themes.
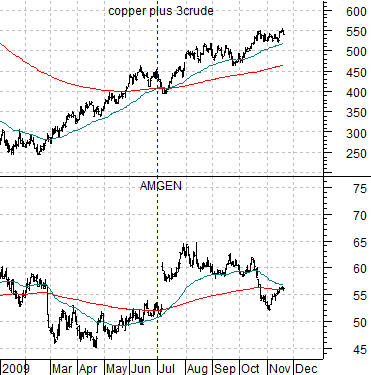
Above we showed how AMGN’s share price rose right on cue this year to signal a dollar bottom and peak for energy and metals prices. Yet… energy and metals prices continued to rise. What did we miss?
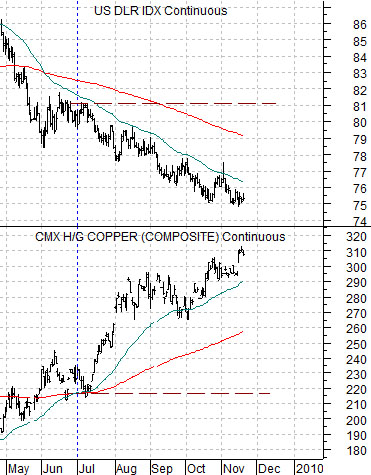
The chart below compares the U.S. Dollar Index (DXY) futures with copper futures. We expected the markets to pivot early in the third quarter but from July into November the dollar has been lower and lower and lower while copper has risen from the 2.20 level through 3.00.
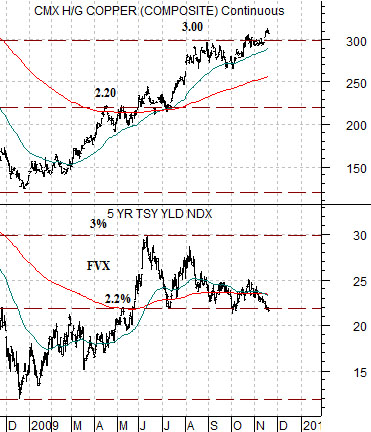
In a sense we were just enough ‘right’ to be dangerous. To explain we show the comparison between 5-year U.S. Treasury yields and copper futures below right.
Another part of the argument was that copper PRICES were tracking very closely with 5-year Treasury YIELDS. With yields peaking in July close to 3.0% we could justify the extension of the rally for copper prices from 2.20 up to 3.00 in August as merely being a ‘catch up’ move to complete the sequence. Yields rise to 3% with copper grinding up to 3.00 a month or two later. Fair enough.
The overall view dates back to something that we have focused on rather intently in the past. It had to do with the tendency in recent years for the markets to drive yields higher along with energy and metals prices through the first half of the year and then pull yields, energy, and metals prices lower through the back half of the year.
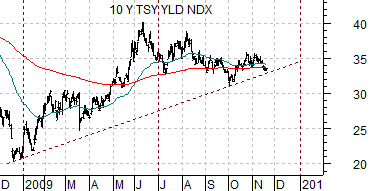
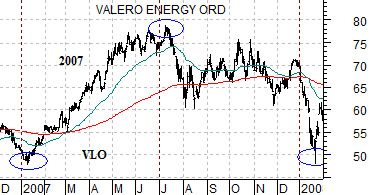
The charts below compare 10-year Treasury yields from 2009 with the share price of oil refiner Valero (VLO) from 2007. We are using VLO to represent one of the many facets of yields/energy price cycle.
VLO bottomed in January of 2007, peaked in July of 2007, and bottomed once again in January of 2008. Our thought was that yields this year could follow a similar path with a mid-year peak and an end-of-year bottom.