The thesis is that we are going to go through a period of marked energy price weakness and the markets will view it as a good thing. This is a difficult argument to make given that the equity markets are still rising and falling with oil prices and only three or so years after the utter collapse of energy and equity prices during the second half of 2008. Difficult perhaps but not impossible.
At the heart of the argument rests the current position of the ratio between crude oil and the CRB Index. We have shown in past issues that the peak for energy prices in 2008 was reached when the price of crude oil rose to more than 30% of the level of the CRB Index.
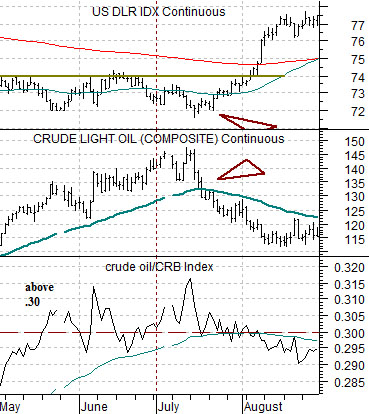
The chart below is from 2008. It compares the crude oil/CRB Index ratio with crude oil futures and the U.S. Dollar Index (DXY) futures.
The idea is that in May of 2008 the crude oil/CRB Index ratio moved above .30. This marked the lows for the dollar and preceded the cycle peak for energy prices by a couple of months.
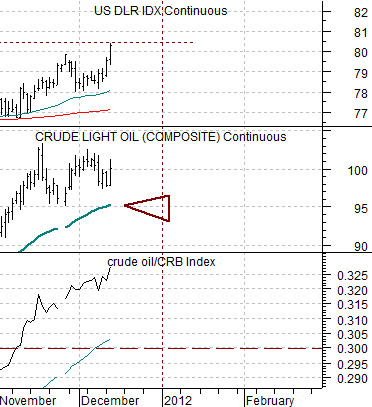
Below is the same chart from the current situation. The argument is anchored by the observation that the crude oil/CRB Index ratio has once again moved up through .30.
When we went through this perspective last month we concluded that if history were to be kind enough to repeat the push above .30 for the ratio would mark some kind of major price top for energy prices. The problem is that while a ratio above .30 might be ‘high’ there is no way of knowing how long it might take before the ratio started to fall.
We handled this as best as we could be showing that a trend change should include a break by crude oil futures down through the 50-day e.m.a. line. In other words while we might have to give up the first 5% to 10% of the move it appeared reasonable to let crude oil close below its moving average line before getting too excited.
At present the moving average line is around 95.
Equities/Bond Markets
So… we started things off today with the argument that oil prices relative to the CRB Index are at similar levels to mid-2008. We also observed that the equity markets have been rising and falling with oil prices for years so there must be some reason why we are attempting to make the case that ‘this time is going to be different’. In other words it might make more sense to argue that as slide in oil prices will accelerate the downward pressure on the equity markets- as it did in 2008- leading to a veritable collapse.
The problem is… AMR’s share price has almost declined to zero. How much worse can things get for the autos and airlines if energy prices actually decline?
Let’s make this as simple as possible. The key lies with the bond market. In 2008 long-term yields fell as oil prices declined. Our argument is that this time around long-term yields could actually rise in response to lower oil prices. For this to happen, however, we will likely have to see considerable pressure on gold prices which is, of course, an entirely different argument.
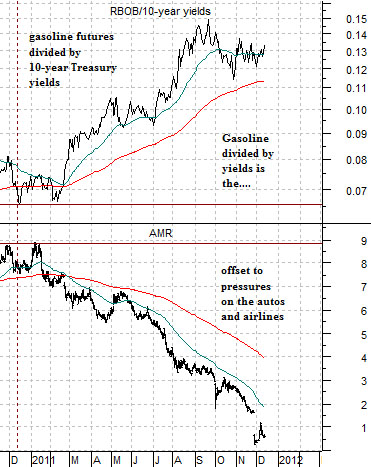
Just below is a comparison between gasoline futures prices (RBOB) and 10-year Treasury yields along with the share price of AMR.
We have argued that AMR represents the energy ‘user’ theme. This is the cyclical theme that does better when yields are rising and energy prices are softer. In particular this is a theme that suffers when oil prices are excessively strong… which was the case in 2008 and is the case at the end of 2011.
There are a number of ways to show the ‘offset’ to the energy ‘user’ theme. One way to do so is using the ratio between gasoline prices and 10-year yields. Rising fuel costs and/or falling yields are bearish while falling yields costs and/or rising yields is bearish.
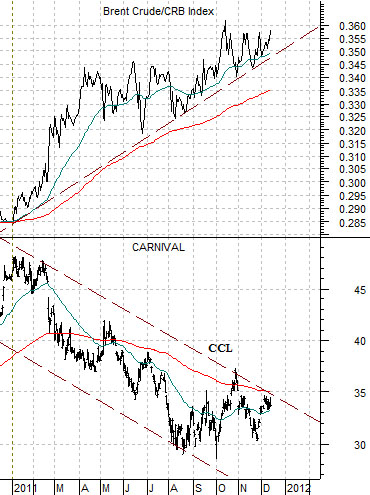
Another spin on the argument has been the ratio between Brent crude oil and the CRB Index. In recent years upward pressure on WTI has come in large part from the strength in Brent. One might argue that the strength in European-based oil prices has much to do with the Eurozone’s current state and that a return to a better and more stable situation will require a major decline in Brent crude futures prices.
Next is a comparison between Brent crude oil and the CRB Index along with the share price of Carnival Cruise Lines (CCL).
We have shown this chart on many occasions and have been in the habit recently of running it almost daily in the back pages.
We are watching this chart because our view is that if the Brent/CRB Index ratio breaks down through its rising support line… everything might change. Everything that we all know to be true will suddenly reverse. Pressure from energy prices will abate. Pressure on European growth from energy prices will fade. The reason to own commodity-based currencies will disappear. The need to be over weight energy stocks will no longer exist. The reason to avoid the energy ‘user’ sectors- including the autos, airlines, and cruise ships- will become the reason why these sectors will now start to outperform.