Our basic view is positive on equities and negative on bonds. We are still tilted negative on the U.S. dollar (see page 3) for the time being but would like to see downward pressure build on the Japanese yen and Swiss franc.
We are going to show two rather bullish perspectives today with respect to the cyclical trend.
At top right is a chart comparison between 10-year Treasury yields and the ratio between the Nasdaq Composite Index and the S&P 500 Index.
The argument is that the Nasdaq/SPX ratio trends with cyclical growth as well as long-term interest rates. When the Nasdaq is stronger than the S&P 500 Index it usually means that the economy is expanding leading to higher yields.
The detail that we find interesting here may be hard to see given the time frame that we have chosen to present. The Nasdaq/SPX ratio bottomed in November of 2008- one month before yields hit a low- and then corrected down through the 200-day e.m.a. line to set a second bottom in August of this year- one month ahead of the low point for 10-year yields.
With the ratio pushing now pushing higher the argument is that 10-year yields have just completed a second post-crisis bottom and are now pushing to the upside.
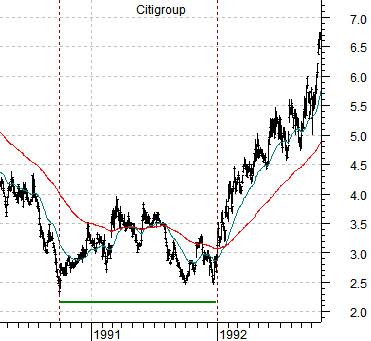
Below right we have included a chart of Citigroup (C) from 1990- 92.
There was a period of around 15 months following the equity bear market bottom in 1990 when the share price of C lagged the recovery due to negative pressures on the financials from problems in the real estate market. Our thought was that the ‘two bottoms’ set by C between the autumn of 1990 and the end of 1991 appeared quite similar to the chart of 10-year yields from the current time frame.
So… what outcome might fit best with the Law of Unintended Consequences this time around? The charts suggest not only higher long-term yields through 2011 by potentially MUCH higher yields as the expansion starts to gain real traction. With C falling from 4 to below 2.50 in 1990 and yields moving down from 4.0% to under 2.5% in late 2008 a lift off from 2.5% would look an awful lot like the start of the bull market for C from the 2.50 range at the end of 1991. That would be a bit of a knee-buckler for the holders of long-term Treasuries.

We have spent much of the past decade or so arguing that the key to Japan’s escape from deflation rests with rising long-term Japanese interest rates. We fully expect that if, as, or when Japanese yields start to rise the consensus view is that this will kill the recovery but our view is that rising yields actually confirm the recovery.
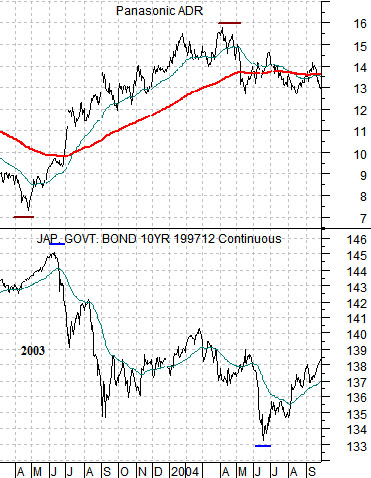
At top right is a chart comparison between Panasonic (PC) and 10-year Japanese (JGB) bond futures from 2003- 04.
The first point is that Panasonic bottomed and turned higher a month or so before Japanese bond prices turned lower. As PC pushed above its 200-day e.m.a. line the Japanese bond market started to tumble.
The second point is that the first cycle peak for PC was made almost exactly one year AFTER it made its bottom in June of 2003. In other words PC rallied from June of 2003 into June of 2004. We mention this because the Japanese bond market peaked in July of 2003 and bottomed one year later in July of 2004.
Below right we show the same comparison from the current time frame. Notice that PC has risen through its moving average line after setting a bottom in August. If history were to be kind enough to repeat the rally would extend into August of 2011 with the next cycle bottom due for the JGBs in October of next year. In the mean time PC has to close well above the 15 level to held confirm that this is indeed the start of a positive price trend.
Quickly… below we show a chart of the SPX and two moving average lines for the CBOE Volatility Index (VIX). The argument is that in the post-2000 time period stock market tops have gone with bottoms for the VIX. In fact a rising equity trend has gone with the 200-day crossing down through the 500-day e.m.a. line while a bearish trend was set in 2007 when the 200-day crossed back up through the 500-day. The point? For now the trend still looks nicely positive as long as the VIX stays well below the ‘25’ level. It ended yesterday, by the way, at 18.64.