The problem with most intermarket relationships is that they exist- more or less- in what one might call ‘real time’. A concurrent relationship like the weak dollar and stronger commodity prices might explain what the markets have been and are doing even though there is a distinct lack of predictive information involved. If push comes to shove we much prefer relationships based on leads and lags because they tend to help us get a sense of the future instead of merely gaining a grasp of the present.
The Japanese bank shares were stronger yesterday following what we believe to be an unconfirmed report that they will be given up to 10 years to strengthen capital ratios. What this means, we suspect, is that Mizuho (MFH) and Mitsubishi UFJ (MTU) may not have to sell bucket loads of stock at current depressed prices.
Between the time of writing and the opening of trading today the situation might change completely but since we have shown MTU from a number of perspectives over the years- without much in the way of success we should add- we thought we would feature a lead-lag comparison that would explain why this sector might surge to life over the coming months.
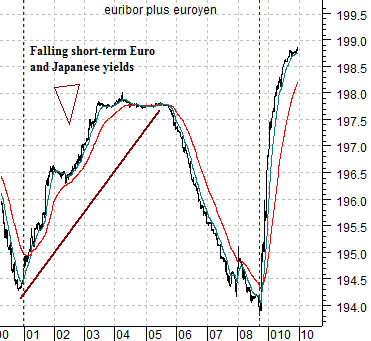
Below is a chart of the sum of 3-month euribor futures and 3-month euroyen futures. In essence we have combined the prices of short-term European and Japanese debt so that a rising line- as was the case starting in 2001- depicts falling short-term yields.
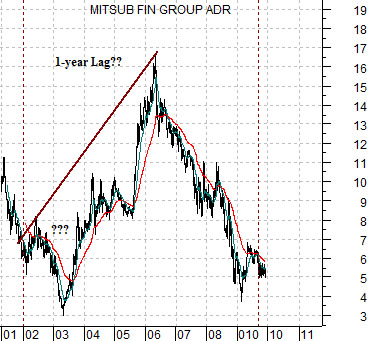
Below is a chart of Mitsubishi UFJ (MTU). The chart has been shifted or offset by one year so that, for example, 2002 is lined up with the sum debt price sum from 2001.
The argument is that MTU lags significant trend changes in short-term European and Japanese debt prices by one year. Put another way when yields begin to decline the share price of MTU turns upwards a year later and when yields begin to rise MTU continues to climb for a year before turning back to the down side.
If the comparison holds then the abrupt upward pivot in debt prices during the fourth quarter of 2008 would argue for an equally surprising positive trend change for MTU towards the end of this year. With the significant overhang of a trillion yen or so of share sales perhaps MTU is finally ready to shift out of the down trend that began back in 2006.
Equity/Bond Markets
As long as we are on the topic of Mitsubishi UFJ and the Japanese banks we might as well roll on with it.
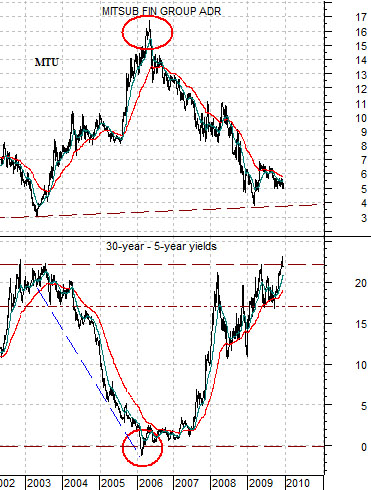
Below is a comparison between MTU and the spread or difference between 30-year and 5-year U.S. Treasury yields.
The argument is that MTU tends to bottom when the yield spread reaches its highest levels and then peak when the yield spread declines to a cycle low.
The chart shows that the spread between 30-year and 5-year yields rose up to around 2.2% during late 2002 and held there through the middle of 2003. As the yield spread slowly declined from 2003 into 2006 the share price of MTU pushed higher. Eventually the spread moved below the ‘0’ line as the yield curve inverted.
The good news is that the yield spread has risen back to the peak levels of 2002- 2003. The bad news is that this relationship works nicely- give or take a quarter or three.
In order for the yield spread to turn lower one of two things has to happen. Either shorter-term yields have to rise or… longer-term yields have to decline. Either 5-year yields currently around 2.33% have to move up towards 30-year yields around 4.53% or… long-term yields have to squeeze back to the down side.
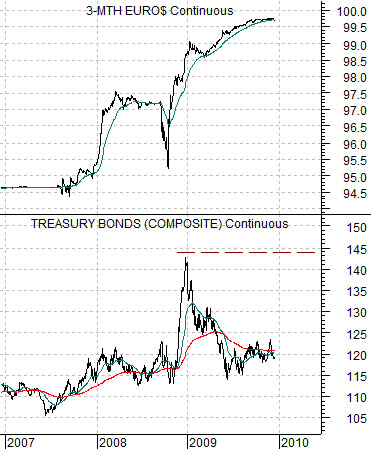
Below is a comparison between 3-month eurodollar futures and 30-year U.S. T-Bond futures.
We suspect that it wouldn’t be too difficult to build a case that U.S. economic growth will recover during 2010 leading to a series of Fed funds rate hikes which would help to flatten out the yield curve. There is another possibility, however, that would come into play if the global economic stimulus efforts start to lose traction over the coming months.
The chart comparison shows that there is a fairly basic relationship between short-term (3-month eurodollar futures) and long-term (30-year T-Bond futures) prices. The twist- this year- has been the weakness in the long end of the bond market even as short-term prices have pushed steadily higher. This is the divergence that eventually will have to be resolved.
The Fed maintains that it will hold the funds rate near 0% for an extended period of time. As long as the markets believe that this is true there is an incentive to borrow short and buy long. An incentive to take almost free money from the Fed and lever it up and out through the purchase of higher yielding long-term Treasuries.
It may well be that short-term yields start to push higher early in 2010 to signal the start of what may prove to be a rather lengthy series of Fed rate hikes. However if the economy shows signs of stalling with 3-month eurodollar futures trading flat near the highs then we can most certainly envision a scenario where the TBonds curl back up to the highs over the coming months.
Our point is that the yield curve will eventually begin to flatten but even at this late date it remains unclear whether short yields will rise or longer-term yields will decline.