We often use quotes from news articles to help make our point but rarely do so to the extent that we are doing today.
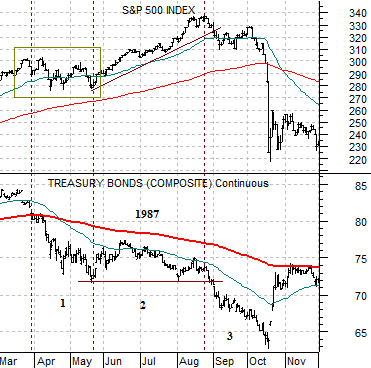
Just below is a chart of the S&P 500 Index and U.S. 30-year T-Bond futures from 1987. The argument has been that the stock market reached a ‘bubble peak’ in August of 1987 following a 3-month consolidation of longer-term bond prices below the 200-day e.m.a. line. The pressures leading into the October ‘crash’ began to build once bond prices broke back to the down side in August.
WASHINGTON (April 12, 2011) – With gas prices approaching the all-time high per gallon in the United States, House Democrats are stepping up their efforts to deploy a small fraction of the nation’s oil reserves to tamp down speculation and reduce prices for American families and small businesses… While supplies of gasoline remain at similar levels to this period last year, prices are nearly one dollar more at the pump for regular grade gasoline. Many economists have said that up to $20 of the price of a barrel of oil is currently from speculation in the marketplace that does not reflect true supply and demand. As events unfold in Libya and across the Middle East, prices could continue to spike higher, potentially stultifying the nascent U.S. economic recovery. Therefore, the members of Congress suggest using the Strategic Petroleum Reserve soon.
“[I]n the short term, considering releasing oil from the SPR as we approach the summer driving season could help prevent oil prices from escalating as they did in 2008,” write the lawmakers. “Releasing even a small fraction of that oil could have a significant impact on speculation in the marketplace and on prices. It would also remind the world that the U.S. is ready, willing and able to use the SPR aggressively and effectively if needed.”
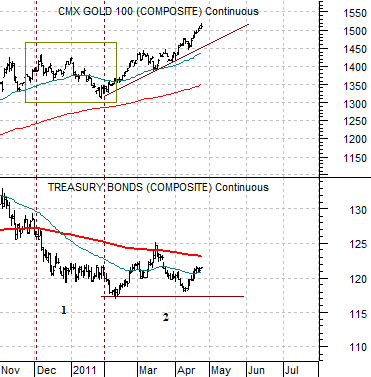
Next we show gold futures and the TBond futures. The charts are similar to the SPX and TBonds from 1987. If gold were to ‘crash’ in a manner similar to the equity markets in 1987 then initial ‘driver’ would be a sharp decline in bond prices. What might precipitate such a move? Perhaps the Fed will do something that will surprise the markets later this week or… perhaps the Obama administration will shock the markets by dumping oil from the reserve. To the extent that rising energy prices threaten to slow U.S. economic growth which, in turn, is helping to push bond prices higher this actually makes quite a bit of intermarket sense. The charts suggest that something of importance for the bond market, dollar, gold, and crude oil may take place within the next week or so.
Equity/Bond Markets
In a sense prices can rise and fall- even abruptly- on any given day but actual watershed-type trend changes rarely take place. Our view is that for one market to turn from up to down another market usually has to be ready to switch from down or flat to up.
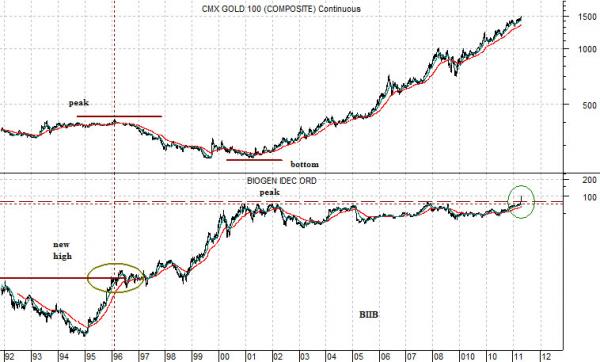
To explain… we have included a chart below of the share price of biotech company Biogen (BIIB) and gold futures from the end of 1991 to the present day.
Biogen’s stock price peaked around the start of 1992 and didn’t rise back to new highs until early in 1996. As BIIB pushed to new highs the price of gold reached a peak. Gold continued in a bearish trend from 1996 into 2001 as BIIB rose to its next cycle high.
From 2001 into 2011 the share price of BIIB trended essentially flat as gold prices ramped upwards. After a decade of commodity and precious metals price strength… BIIB punched to new all times highs at the end of last week.
Our point- we trust- is fairly straight forward. Biogen has traded flat for a decade with gold prices trending higher so now that it has changed trends from flat to up… a case can be made for a weaker gold price trend.
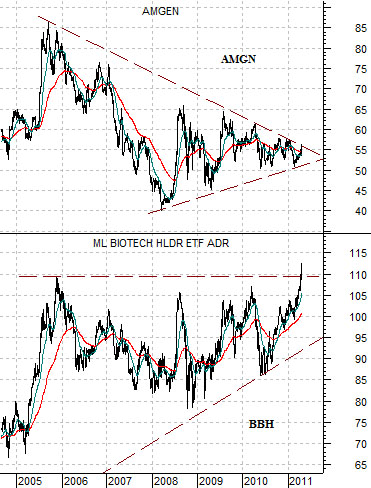
The argument would have been a bit more compelling if Amgen (AMGN) had followed Biogen through resistance. At top right is a chart of AMGN along with the biotech holdrs (BBH). The BBH has finally taken out the peak levels from 2005 (we have adjusted it to account for Roche’s take over of Genentech along the way) but would like to see AMGN push above the resistance line with a close through roughly 57.