We are going to begin with Netflix in the context of the trend for short-term yields, focus on what drove yields higher back in 2004, compare it to the current situation, and then eventually end up with yet another bullish argument in favor of the banks.
The inspiration for today’s chart-based journey came from the sharp price break for the share price of Netflix (NFLX) following earnings that apparently beat analyst expectations. While this may prove to be a temporary pull back in an ongoing positive trend… it reminded us somewhat of Boston Scientific (BSX) back in 2004. So… that is where we will begin.
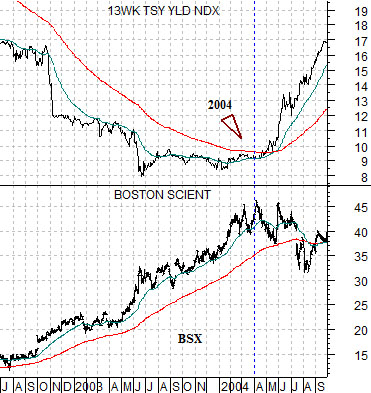
Below is a comparison between BSX and 3-month U.S. TBill yields from 2002 into 2004.
BSX rose from the end of 2000 into 2004 under the cover of downward pressure on short-term interest rates. As upward pressure on yields started to show up (months ahead of the first Fed rate increase in June of that year) the share price of BSX began to chop. From 2002 into 2004 the price corrections were generally contained at the rising 50-day e.m.a. line but into May of 2004 the break carried all the way back to the 200-day e.m.a. After a quick spike back to the old highs the share price shifted into a negative trend that continues to this day.
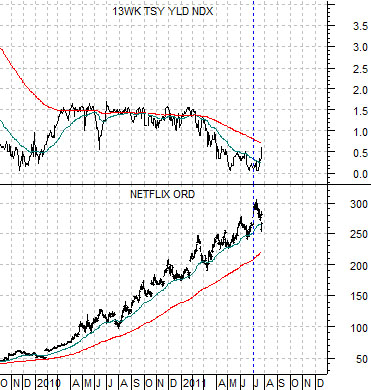
Next is a comparison between Netflix and U.S. 3-month TBill yields from the current time frame.
Netflix might be the next great long-term growth story but, then again, it might simply have benefited from the paucity of growth alternatives that tends to show up during periods of declining interest rates.
Our thought was that similar to BSX through 2003 the corrections for NFLX during its rising trend had basically held close to the 50-day e.m.a. line so this becomes somewhat more serious if the price correction carries all the way back to around 220 (200-day e.m.a.) Even then the share price could rocket back towards the highs but this would help to add some credence to our contention that we could be very close to the start of rising U.S. short-term interest rates with the potential for the Fed to hike the funds rate as early as this September.
Equity/Bond Markets
Fed rate hike in September? That is crazy talk. We are balanced on the edge of so many crises at present that this simply can’t be possible. This year alone crisis in the Middle East and North Africa has spiked oil prices, Japan’s economy has been dealt an alligator death roll following a horrendous natural disaster, half of Europe apparently is heading into default, and the U.S. government is poised to take an unplanned summer vacation. Crazy talk. Or is it?
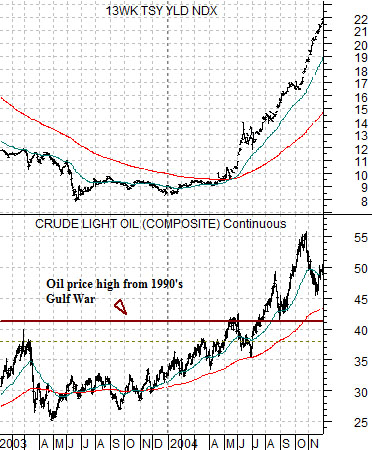
Below is a chart of U.S. 3-month TBill yields and crude oil futures from the end of 2002 into 2004.
In the spring of 2004 we were arguing that the Fed had held the funds rate too low for too long a time period and that the markets would force yields higher through rising energy prices. We made the (at the time) extreme price target for crude oil futures of 75. Of course crude oil was trading closer to 35 and had been below 41- 42 since the price spike associated with the Gulf War in 1990 so 75 seemed like a fairly robust target price.
The chart shows what subsequently happened. Crude oil futures began to gather price strength in 2003 and by the spring of 2004 had moved above the 2000 and 2003 peaks. By the third quarter of that year oil prices had risen through the 1990 top while along the way the trend for TBill yields had clearly begun to rise.
Anyway… the points are as follows. First, short-term yields did not rise simply ‘out of the blue’. A major cyclical theme pushed yields to the upside with the Fed following the market a couple of months later. Second, the theme (energy) that initiated the upward pressure on yields dominated the markets for the next several years.
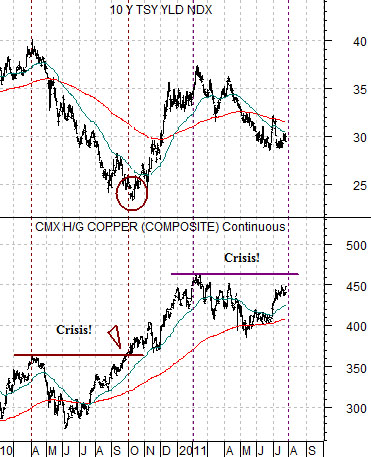
Next is a chart of copper futures and 10-year Treasury yields.
We have been batting back and forth between copper and the Nasdaq in our search for an emerging cyclical trend ‘driver’. In fact it may well prove to be something that we haven’t even considered but for now we are focusing on these two sectors.
The argument with respect to copper is shown at right. The markets went through a period of perceived ‘crisis’ in 2010 as copper prices stopped making new highs. As soon as copper moved back to new highs in early October the trend for 10-year yields pivoted back to the upside.
The markets have followed essentially the same pattern this year after copper prices reached a peak in February. Out of the blue we were hit again and again with Libya, Greece, Japan, Greece, the U.S. debt limit, Greece, Portugal, Greece, and the U.S. debt limit. Yet… as we approach the time period six months following the last peak for copper futures prices we see that copper is within striking distance yet again of new highs.
The idea is that copper is capable of pushing long-term yields higher- temporary- as long it is making a series of new price highs. Obviously if copper moved above 4.60 and continued to rise without pause all the way to 10.00 (just a little more crazy talk. We aren’t forecasting 10.00 copper. Really. Unless it moves to 10.00 of course) long-term yields would rise to the point where short-term yields would be forced to follow. We will continue with our arguments on the following page.