We are going to attempt to cover- quickly- the four outcomes for the equity markets that appear most likely at this time. We have done all of these in one form or another in the past but we thought we would try to put them all together into one issue.
The first potential outcome is, more or less, onwards and upwards as those waiting for a test of the lows are simply left to chase the markets at ever higher levels.
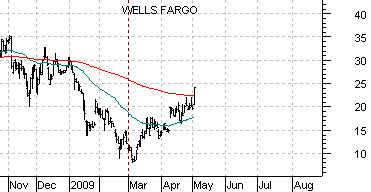
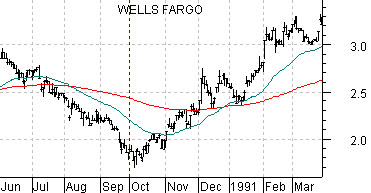
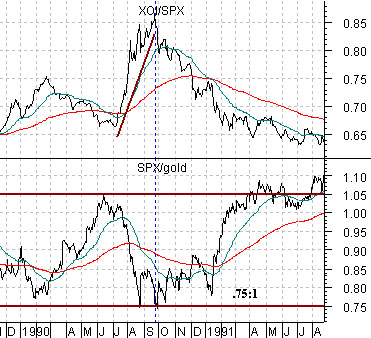
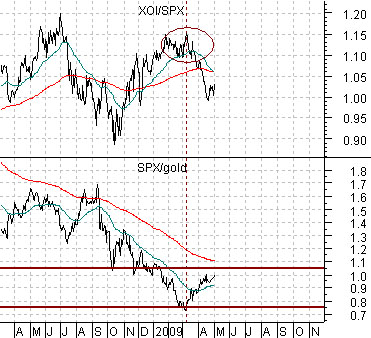
There have only been two occasions since the 1980’s when the S&P 500 Index declined to only 75% of the price of gold. The first was in the autumn of 1990- shown at top right- which marked the peak for the ratio of the major oil stocks to the broad market (XOI/SPX). The second was in early March of this year which also went with a relative strength peak for the oils. In ‘1990 the equity markets simply pushed higher as shown through the chart of Wells Fargo (WFC) below. The current situation is remarkably similar to early December of 1990 which supports the ‘onwards and upwards’ alternative.
Equity/Bond Markets
Over the past few months we have focused on the idea that at major turning points coinciding with either extreme strength or weakness in the economy the ‘base trend’ turns well ahead of actual prices.
The argument was that in both 1981- 82 and 2000 the ‘base trend’ turned with the bond market while the equity markets lagged in response by around 8 or 9 months. In other words… with the ‘base trend’ turning positive at the peak for long-term Treasury prices late last year the expectation was that the equity markets would rally into May, sag back into August, and then resolve powerfully higher through into 2010.
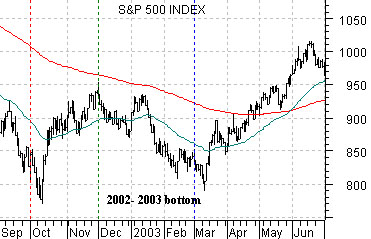
In yesterday’s issue we showed another way that the equity markets lagged the start of a rising trend. In 2002 the trend turned positive in October before correcting back and testing the lows into March of 2003.
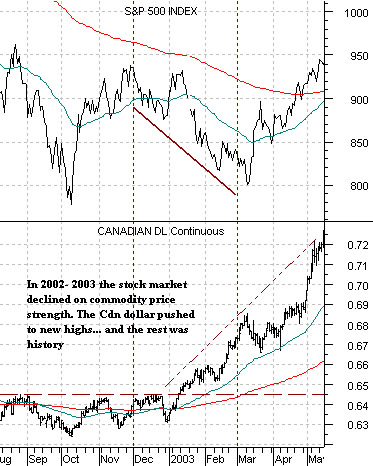
The second potential outcome would be a retest of the lows based on commodity price strength.
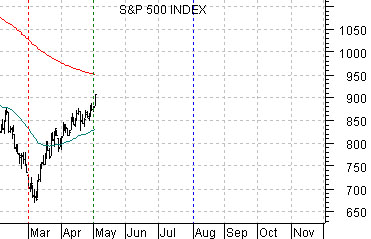
Belowwe compare the S&P 500 Index (SPX) from 2002- 2003 with the current situation. In both cases prices rallied back up towards the moving average lines for 2 months.
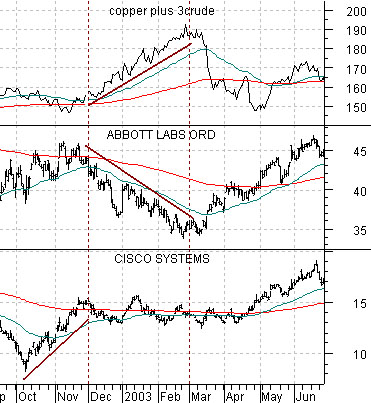
The chart below compares the sum of copper and crude oil futures, the share price of Cisco (CSCO), and the share price of Abbott Labs (ABT) from 2002- 2003.
The argument is that stock market weakness was a reflection of the downward pressure on stocks such as ABT in response to the 30% 3-month surge in energy and metals prices. Once copper and crude oil reached a peak in early March of 2003 the share price of ABT along with the SPX reached a bottom. All of this went with strength in the Cdn dollar.
The second outcome would be a retest of the lows into August based on commodity price and commodity currency strength.