We tend to use the share price of biotech giant Amgen (AMGN) for some of our work with regard to the U.S. dollar. While many have learned that commodity prices rise as the dollar falls it our contention that when AMGN begins to swing upwards it often means that the dollar is getting close to a bottom which means, in turn, that commodity prices are approaching a top.
Our focus of late has been on the ratio between AMGN and crude oil futures prices but for today we will show AMGN all by itself. This is essentially the same argument that we made almost exactly one year ago and since it worked very nicely then… we thought that it would be appropriate to drag it out once again.
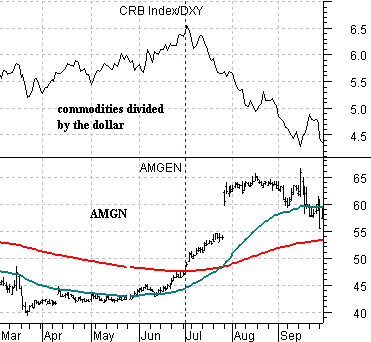
The chartbelow compares AMGN with the ratio between the CRB Index (commodity prices) and the U.S. Dollar Index (DXY) from March through September of 2008.
The argument is and was that when AMGN pushes up through its 200-day e.m.a. line it is time to start looking for a dollar bottom and commodity price top. Last year we suggested that the key would come from the ‘cross’ up through the 200-day e.m.a. line (red line) by the 50-day e.m.a. line (blue line) and, give or take a day, this event marked the start of last year’s dollar ascent.
The CRB/DXY ratio is a ‘high beta’ surrogate for the trend for crude oil futures prices. Stronger commodity prices or a weaker dollar tends to elevate crude oil so as long as this ratio is on the rise the trend for oil prices will remain positive.
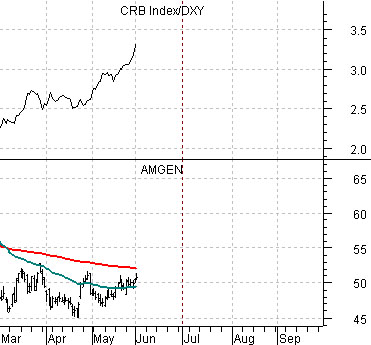
Our point today is that similar to last year the share price of AMGN has been working through a bottom between March and June as commodity prices rage higher in the face of dollar weakness. While AMGN has yet to break back above its 200-day e.m.a. line- it would take something better than 53 to get this done- it has at least worked up to within striking range. The thought is that if AMGN continues to grind higher that we could be working into a replay of last year when the commodity markets peaked at the end of the second quarter leading into a free fall in energy prices and a rapid rise in the dollar through the summer. For now we have AMGN on our radar even though, we should probably stress, no trends have changed as of yet.
Equity/Bond Markets
The markets effectively blew one of our theses to smithereens last month when the commodity currencies surged to new highs. The odd thing is that for much as this cycle is completely unique… it still manages to remind us of 1982 in a backwards sort of way.
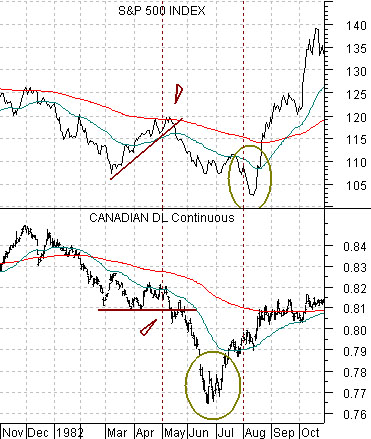
Belowwe show the S&P 500 Index (SPX) and the Canadian dollar (CAD) futures from November of 1981 through October of 1982.
We argued months ago that back in 1982 the Cdn dollar was in a declining trend but as it flattened out between March and May the equity markets managed to rally back up to the 200-day e.m.a. line. In other words in 1982 downward pressure was coming from the commodity sector so ultimately the stock market was not going to bottom until the commodity currencies followed by commodity priced reached a final bottom.
The idea was that the final bout of weakness for the equity markets between May and August was preceded by a break to new lows by the Cdn dollar but… after plunging into June… the Cdn dollar pivoted back to the upside and had returned to its 200-day e.m.a. line by the time the SPX finally swung back into a sustained bull market.
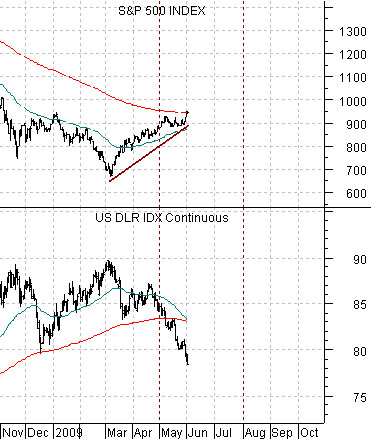
Our thought was that we have most certainly had a ‘March to May’ stock market rally this year but the currency that broke to the down side in May was the U.S. dollar instead of the Cdn dollar. Interesting.
Does this make sense? It actually might if one considers how stocks have been reacting to the bond market of late. In 1982 stock prices rose following a decline in interest rates while in 2009 the stock market has been lifting upwards on rising interest rates. In other words if the stock market was trending with the bond market into 1982 and the chief concern was inflation then the reaction to falling commodity prices and rising bond prices was equity markets positive. This year, on the other hand, the concern has been deflation so rising commodity prices and falling bond prices have been viewed as bullish.
In any event the premise is somewhat thought provoking but we have not spent the time required to work through it from a myriad of perspectives. Our initial point was that similar to 1982 we have a collapsing currency into the month of June.
In yesterday’s issue we commented that the dollar is weak- period. There are a number of relationships that might show improvement over the next few days or weeks but none that are supportive in the short-term. We can (and will) argue that if the Nasdaq starts to outperform commodity prices in general or copper prices in particular that this would be dollar positive and we suggested that a ‘stealth rally’ by Amgen above its moving average line would also be somewhat encouraging but it is still too early to even suggest that a bottom is in sight.
However… our final point has to do with the Canadian dollar’s collapse into June in 1982. The currency broke support, fell like a rock, chopped back and forth, and then rallied nicely into 1983. Of course… it spent all of 1984 and 1985 making new lows before finally bottoming out in 1986 that is a story for another day. For now we have a currency in free fall, it is June, and the markets are working through stock market bottom that we expected would run into August. Time will tell but if we try hard enough it appears that we can conjure up an argument for some kind of dollar bottom this month.