The financial press continues to fixate over the SEC’s civil suit against Goldman Sachs. Many (most) of our views are simplistic and steeped thoroughly in ignorance but our thought is that we don’t like Goldman in much the same way that we detest the New York Yankees. That written… when Major League Baseball introduced the luxury tax to even the playing field so that smaller market and less successful teams could compete… the Yankees wrote their annual cheque and continued to out spend, out play, and out perform their competitors. We love to see the Yankees stumble but we wouldn’t bet against them and we aren’t inclined to bet against Goldman Sachs either. For what it is worth, of course.
We tend to get somewhat amped up each quarter when Coca Cola and Johnson and Johnson report earnings although our expectations are that nothing of importance will happen. Yet… quarter after quarter and year after year these companies expand earnings and increase dividends so eventually the long slide from ‘growth’ to ‘value’ has to come to an end.
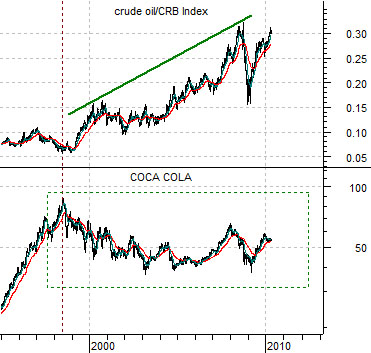
Below is a comparison between Coca Cola (KO) and the ratio between crude oil and the CRB Index.
It is always difficult to know whether strength in one sector creates weakness in another or whether weakness creates strength. In other words we could argue that the 6-fold rise in the ratio between crude oil and the CRB Index since 1998 ‘caused’ the flat trend for Coke’s share price but our sense is that the opposite is true. The cycle peaks for the large cap consumer, health care, and tech stocks between 1998 and 2000 helped create the rising trend for commodity prices as money moved off in search of something- anything- that might rise in price.
The point is that one of these days (years) the share price of Coke will push on to new highs and when that happens the crude oil/CRB Index ratio will stop rising.
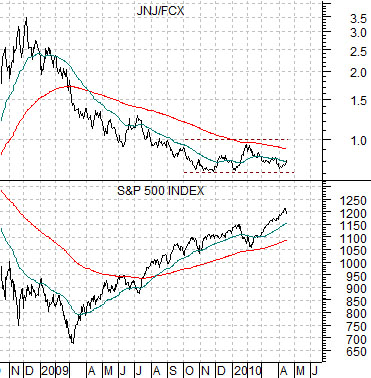
Below is a comparison between the ratio of Johnson and Johnson (JNJ) to FreePort McMoRan (FCX) and the S&P 500 Index. Unless Coke and JNJ are able to rise to new highs every time the markets begin to move away from commodity prices in response to a stronger dollar the S&P 500 Index will decline. A rising JNJ/FCX ratio can only be equity markets positive if JNJ’s share price is actually trending upwards.
Equity/Bond Markets
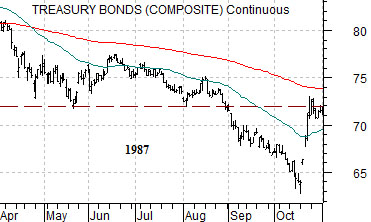
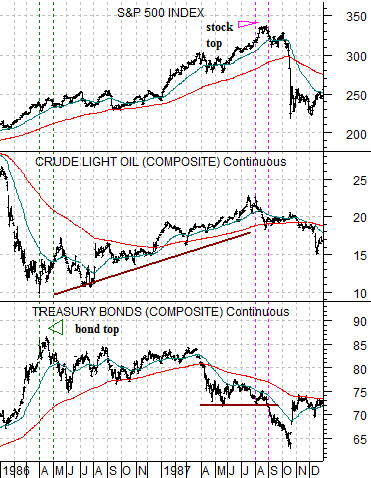
The 1987 stock market crash was the tail end of a sequence that began years earlier.
Into 1985 crude oil prices were extremely strong. In late 1985 and into 1986 crude oil price collapsed resulting in a frantic rise in long-term Treasury prices. At the bottom for crude oil futures prices in the spring of 1986 the bond market peaked and over the next year and a half equities and commodities rose as bond prices declined. Pressures within the markets expanded until equities collapsed and bond prices shot higher in the autumn of 1987.
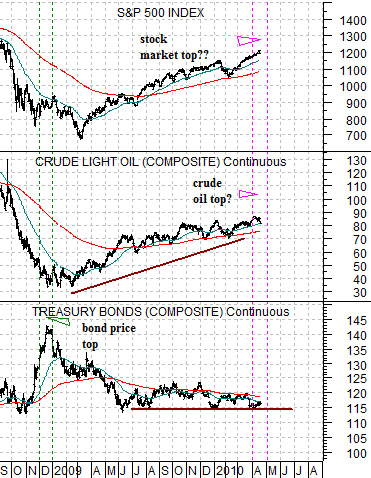
Below we have lined up charts of the SPX, crude oil futures, and the U.S. 30-year T-Bond futures from 1986- 87 with the same markets for the current time period.
If we ‘anchor’ the comparison using the peak for the TBond futures in April of 1986 and then line it up with the highs for bond prices in December of 2008 then a literal interpretation would argue that April of 2010 is equivalent to August of 1987.
The problem- so far- with this argument is that there is still one piece missing. The stock market’s crash in October of 1987 following the peak in August was, in our view, a result of the break to new lows by the long end of the bond market.
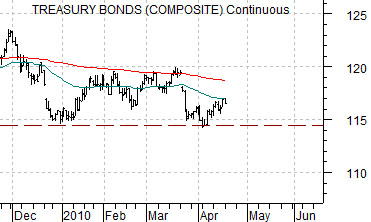
Further below we show the TBond futures from 1987 and the TBonds from 2010.
If the markets are following the same basic script then the argument would be that the bond market has the potential to break down below the lows set in early April leading to a peak in yields and bottom for pries into late May or early June.