We have been arguing over the past few months that the cyclical trend will remain positive into year end. We will quickly go through the chart comparison included below to explain the 2-year lag between the bond market and cyclical asset prices and then move on to the next point which has to do with what happens AFTER the year draws to a close.
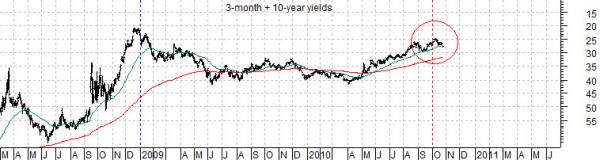
Below is a chart of the sum of 3-month and 10-year Treasury yields from March of 2008 to the present day. This chart is scaled upside down to reflect the trend for Treasury prices (which rise when yields decline).
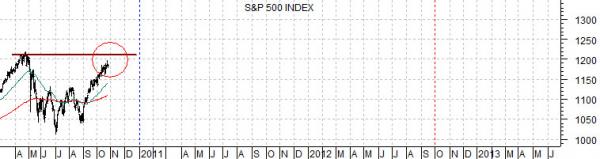
We have also included a chart of the S&P 500 Index beginning in March of 2010. The charts have been offset or shifted by two years so that the trend for bonds in 2008 is lined up with the trend for equities in 2010.
The idea was that it made sense that the SPX sold off during the second quarter because this reflected the negative action in the bond market through the spring of 2008. Once we passed into the third quarter of 2010 the trend shifted to flat-out positive and is expected to remain that way through the balance of the current quarter. Fair enough.
We have argued from time to time that it may take a break to new recovery highs above 1220 by the SPX to truly turn the bond market lower in price. The 2-year lag suggests that the SPX moving through 1220 with bonds falling in price this quarter would lead to a negative trend for cyclical asset prices… way out in the autumn of 2012.
Our thought is that the cyclical trend should remain positive for another couple of months but beyond that conditions seem reasonably constructive for another couple of years.
If yields were to start to rise quickly following the Fed’s new round of quantitative easing the 2-year lag suggests that the next period of cyclical pressure may be as far off as the final quarter of 2012. For that to happen, of course, the bond market would have to turn sustainably lower as we move into year end which, given the inverse relationship between bonds and equities exhibited by the markets, is a fairly major positive for the equity markets.
Equity/Bond Markets
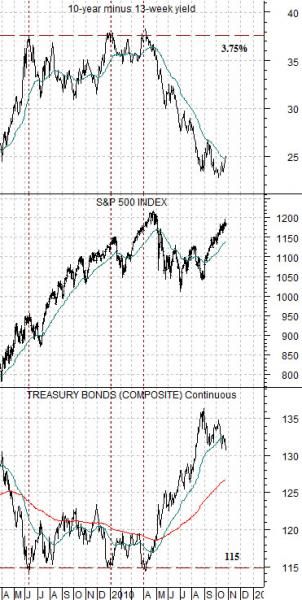
If nothing changes (and it always does) and history repeats (usually in an unexpected manner) then the equity markets should do just fine until one of two things happens. Either the U.S. 30-year T-Bond futures decline from around 130 down to 115 or… the spread between 10-year and 3-month yields widens out to 3.75%. With short-term yields close to 0% chances are that both conditions would be met around the same time.
To explain… below is a chart of the spread between 10-year and 3-month yields, the S&P 500 Index, and the U.S. 30-year T-Bond futures.
Over the last 18 or so months there have been a number of short-term corrections in the SPX and one larger correction. The three most significant pulls backs took place in the summer of 2009, January of 2010, and April of 2010.
In each instance the TBond futures had traded down to around 115 and the yield spread had widened to 3.75%. The bullish argument today is that the TBonds are far above 115 and the yield spread has just risen to 2.5%. In other words… it will take some time before the bond market moves back into an equity market-threatening position.
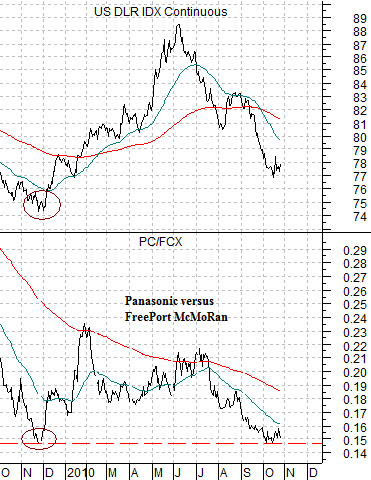
Quickly… just how close are we to a dollar bottom? Perhaps very close. The low point for the dollar in November of last year was marked by a bottom in the ratio between Panasonic (PC) and copper miner FreePort McMoRan (FCX). Once the ratio bottomed just below .15 and started to rise the dollar pivoted upwards. At present the ratio is holding near last year’s lows and the chart comparison between the PC/FCX ratio and the Hang Seng Index shown on page 4 argues that a dollar bottom tends to go with a peak for the Hang Seng Index.