We have been running comparisons to 2008 in recent issues. Given that the second half of 2008 was rather… messy… we thought it might be a good idea to show a few of the current similarities.
In essence one can break 2008 down into two parts. First, the markets had become so one-sided and unbalanced that it was time for prices to rebalance. The cyclical sectors had become so expensive relative to the consumer or defensive sectors that once yields began to trend lower the consumer stocks had to outperform. Fair enough. That is what is supposed to happen.
Second, the downward pressure on cyclical asset prices that went with falling yields and upward pressure on defensive asset prices… collapsed the global financial markets. The end result was the same- defensive stocks rose relative to cyclical stocks- but only because they declined somewhat less.
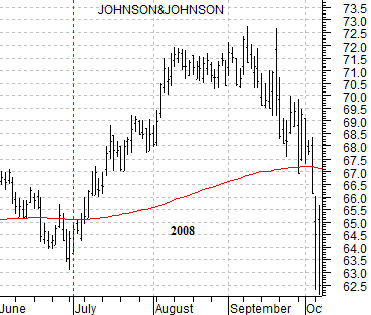
Below is a chart of the share price of Johnson and Johnson (JNJ) from 2008.
Commodity prices peaked at the end of June in 2008 and has the CRB Index and crude oil futures prices declined… the share price of JNJ started to lift. As expected.
Through July and into August JNJ’s price moved higher as consumer stocks rose as an offset to declining yields and commodity prices. As expected.
In September Lehman Brothers filed for bankruptcy as JNJ’s share price followed the broad market lower.
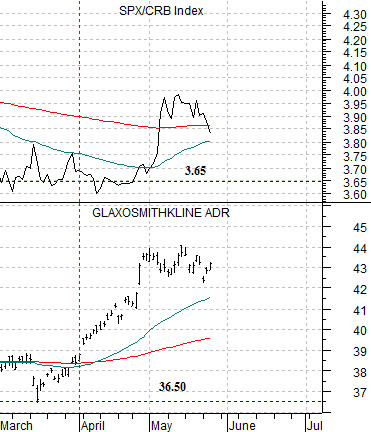
Below is a chart of GlaxoSmithKline (GSK) and the ratio between equities (S&P 500 Index) and commodities (CRB Index).
We have argued that GSK tends to trade quite often at 10 times the level of the SPX/CRB Index ratio. The idea here is that with copper prices peaking in February and crude oil topping out in April the commodity sector may have peaked around the end of the first quarter this year. If so… then this explains why GSK’s share price has started to trend higher.
Our views are as follows. The potential exists for a credit markets crisis. We wish this were not so but with European banks holding what may well be a 100 billion euros in unhedged Greek government debt… it would be naive to argue otherwise.
The commodity markets may not be done for the cycle. A case can be made for an extension of the rally. China is less than a year into monetary policy tightening and we have argued that it often takes around 2 years of rising yields before cyclical asset prices peak. In this instance look for copper prices to continue to lead with new highs above 4.60 marking the start of rising long-term yields and a recovery in the laggard banks.
Obviously… the two outcomes mentioned above are likely mutually exclusive.
A third outcome would include flat to lower commodity prices and continued strength in the consumer stocks. In other words… in 2008 if commodity prices and yields had declined at a slow and measured pace then the share price of JNJ could simply have pushed higher for a few quarters.
The point is that the markets appear very much like 2008 at present but that doesn’t have to be a bad thing. If we get the same basic outcome (i.e. relative strength in the consumer and defensive stocks) without a banking system crisis then all we are really facing is a period of time when the equity markets OUTPERFORM the commodity markets.
Equity/Bond Markets
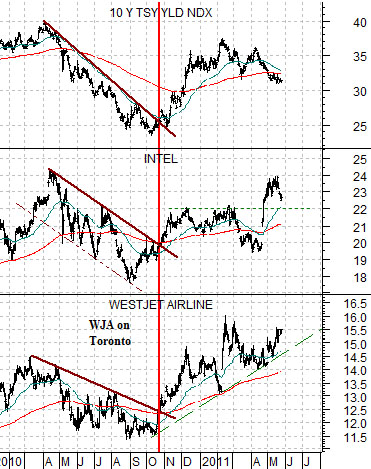
Below is a chart comparison between 10-year Treasury yields, the share price of Intel (INTC), and the share price of Canadian airline WestJet (WJA).
In recent years the basic trend for the equity markets has been similar to the trend for yields. Stocks rise when yields rise and fall when yields fall. When this happens the idea is that one should try to be long those sectors that are making yields rise and ‘not long’ those sectors that are making yields decline. If metals prices are driving yields upwards and the banks are pulling yields lower then the only time to be long the banks is when metals prices are strong enough to raise yields.
In any event… we digress. Intel and WestJet are two stocks that were trading quite closely with yields but have recently diverged. In other words… unless INTC breaks back below 22.00 it is still in a rising trend even as yields move lower. Cyclical stocks that continue to rise in the face of a ‘falling yields head wind’ may do quite nicely once the trend shifts to a ‘rising yields tail wind’.
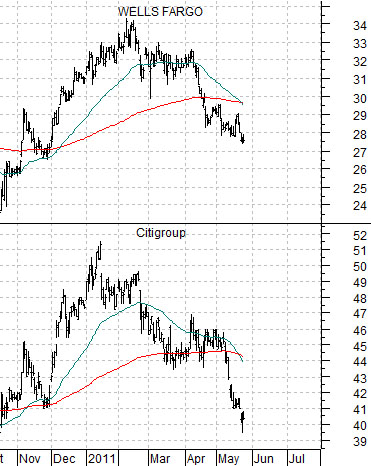
From time to time we wonder whether the current set of real or perceived problems are merely a function of Citigroup’s recent reverse split.
It is our view that one should avoid- for awhile- any stock that does a reverse split. We imagine that there are exceptions to this rule but, in general, once a stock consolidates it tends to decline in price. It is almost a given.
The chart of Citigroup is similar to that of Wells Fargo (at right). Both are below the 200-day e.m.a. line and in both instances the 50-day e.m.a. line is in the process of ‘crossing’ the 200-day e.m.a. This tends to happen around the time that bottoms are made. The point is that C was bound to decline following the reverse split and this has created the impression of a negative trend for the banks and helped pull yields lower. Yet… how much of this was merely the usual and expected reaction to a 1 for 10 share price consolidation?